-
HelMet-taskukirjasto
8.12.2017 -
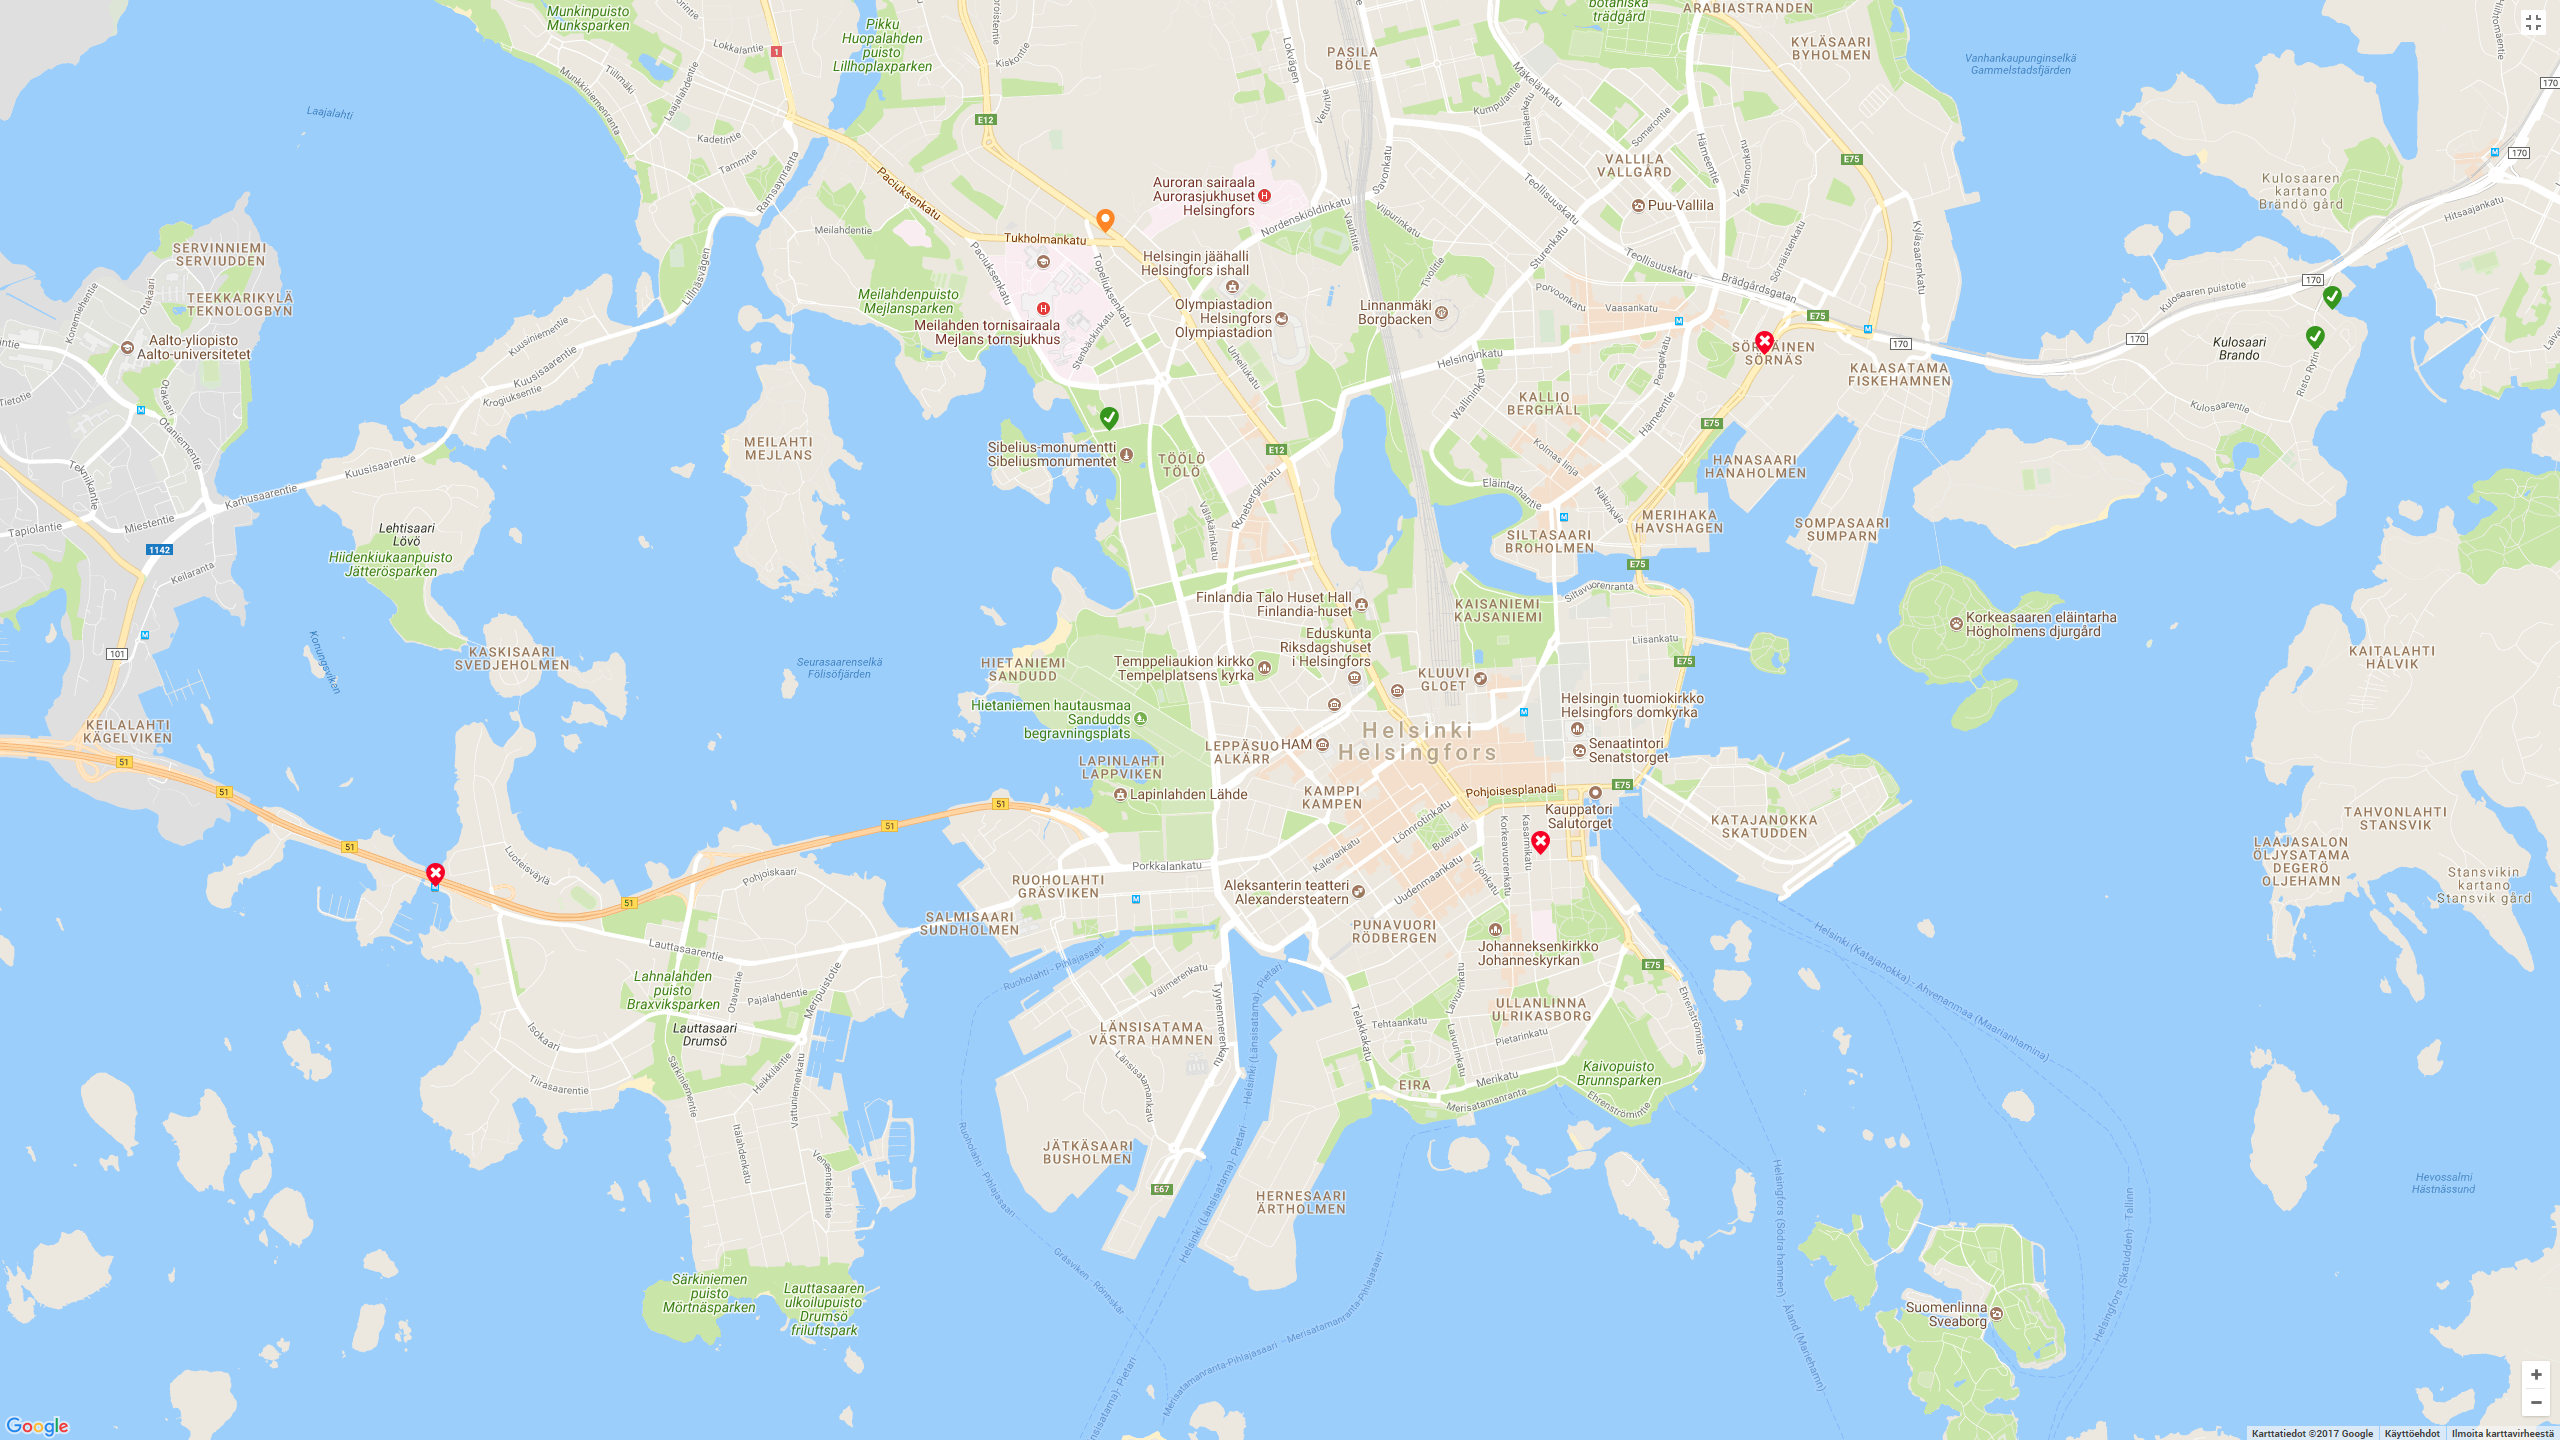
Metro fiksaa
8.12.2017 -
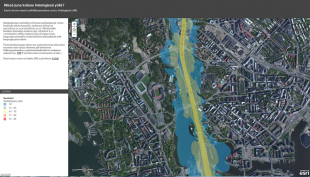
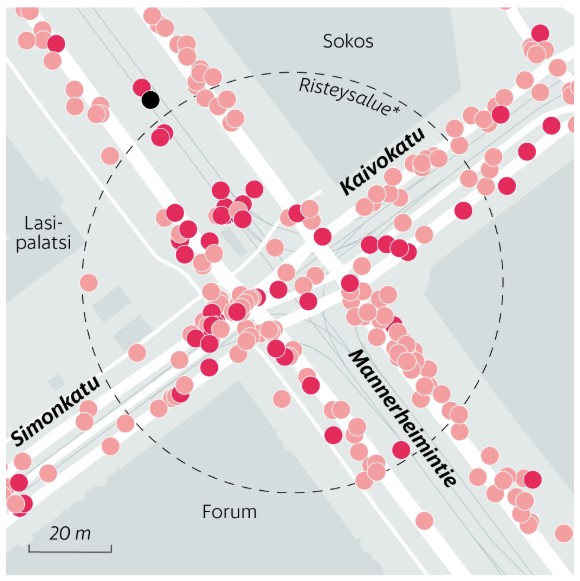
Raidemelu
8.12.2017 -
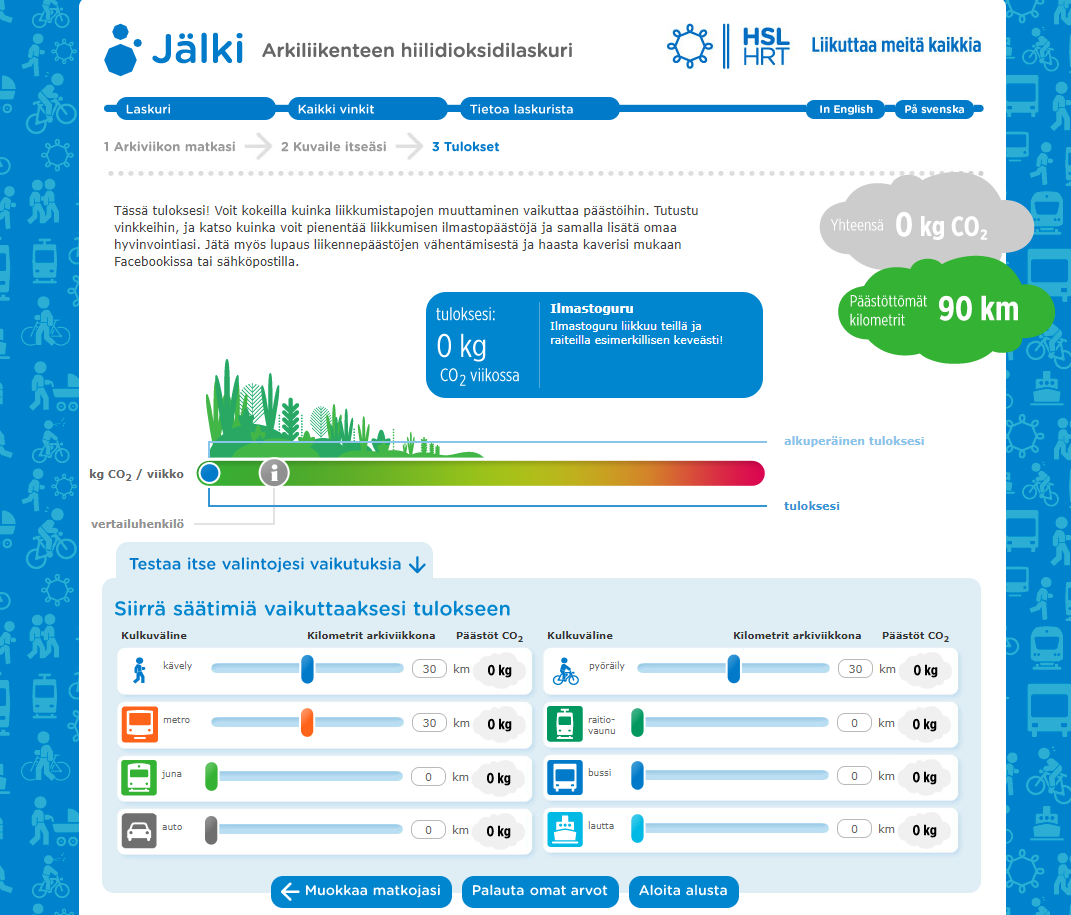
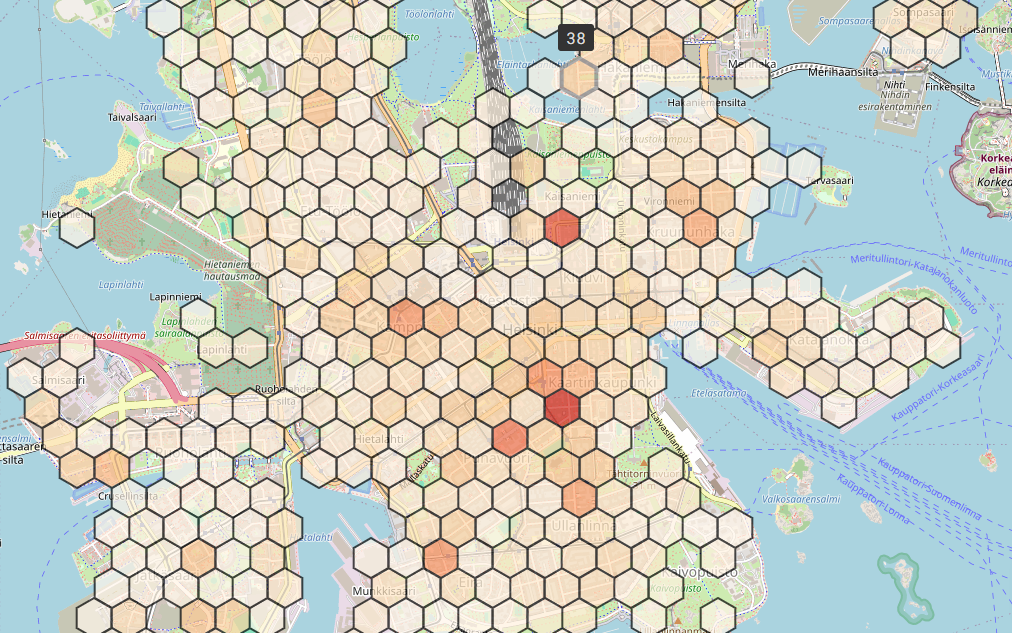
Arkiliikenteen hiilidioksidilaskuri
8.12.2017 -
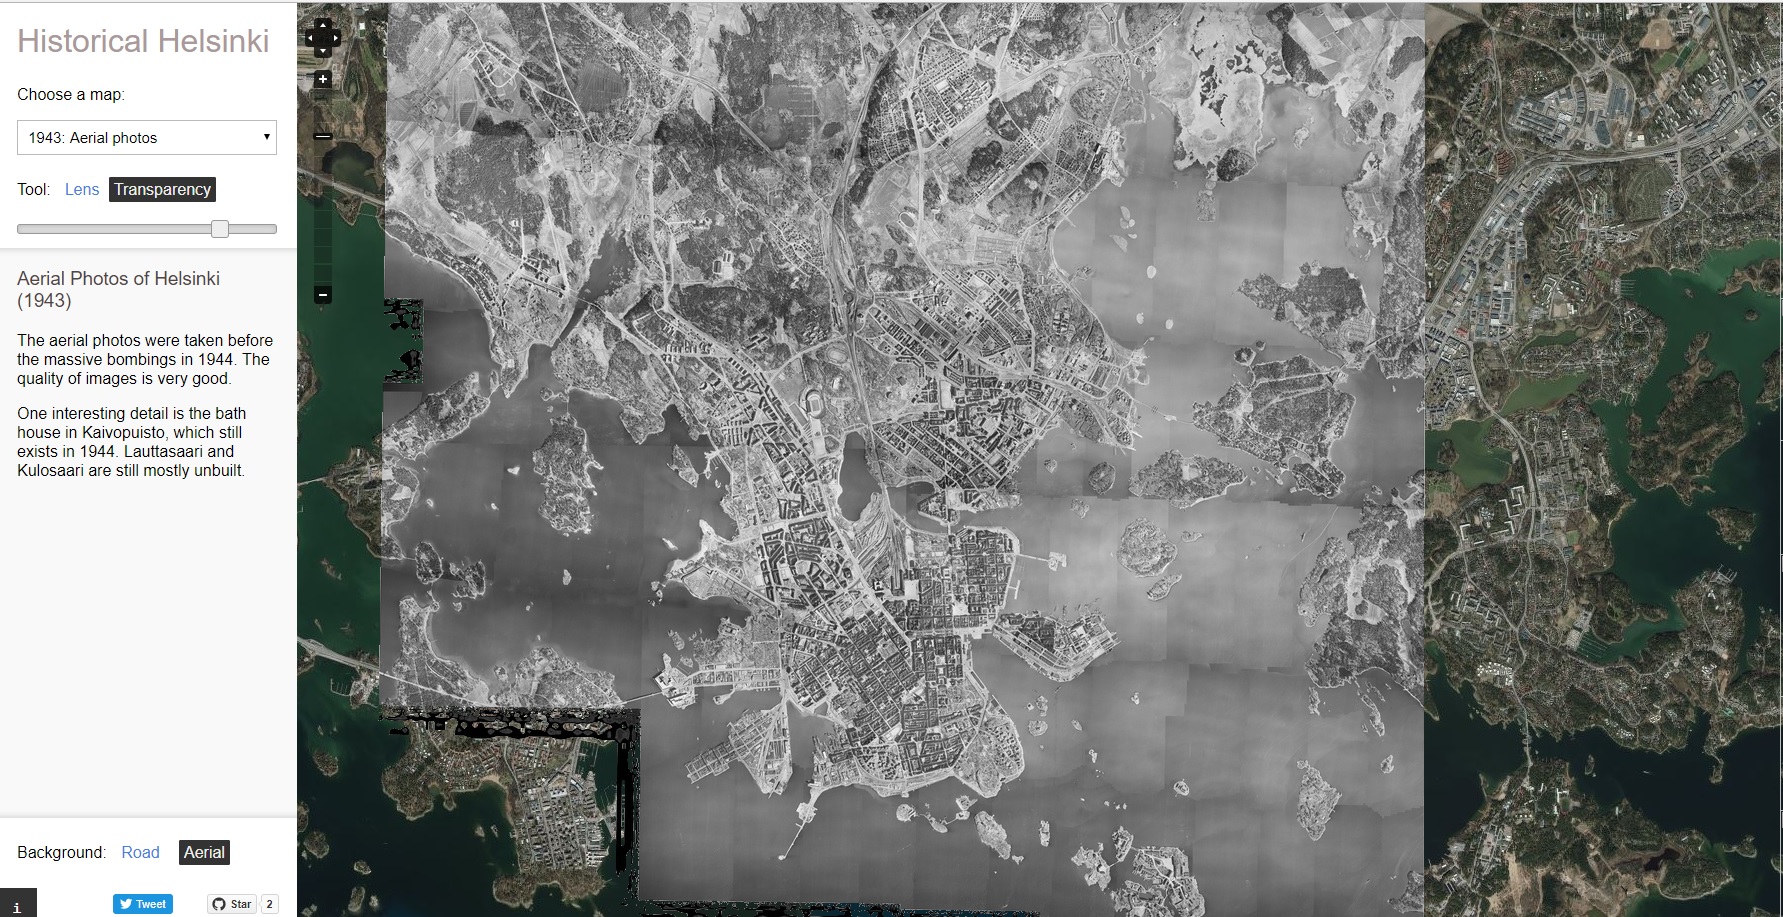
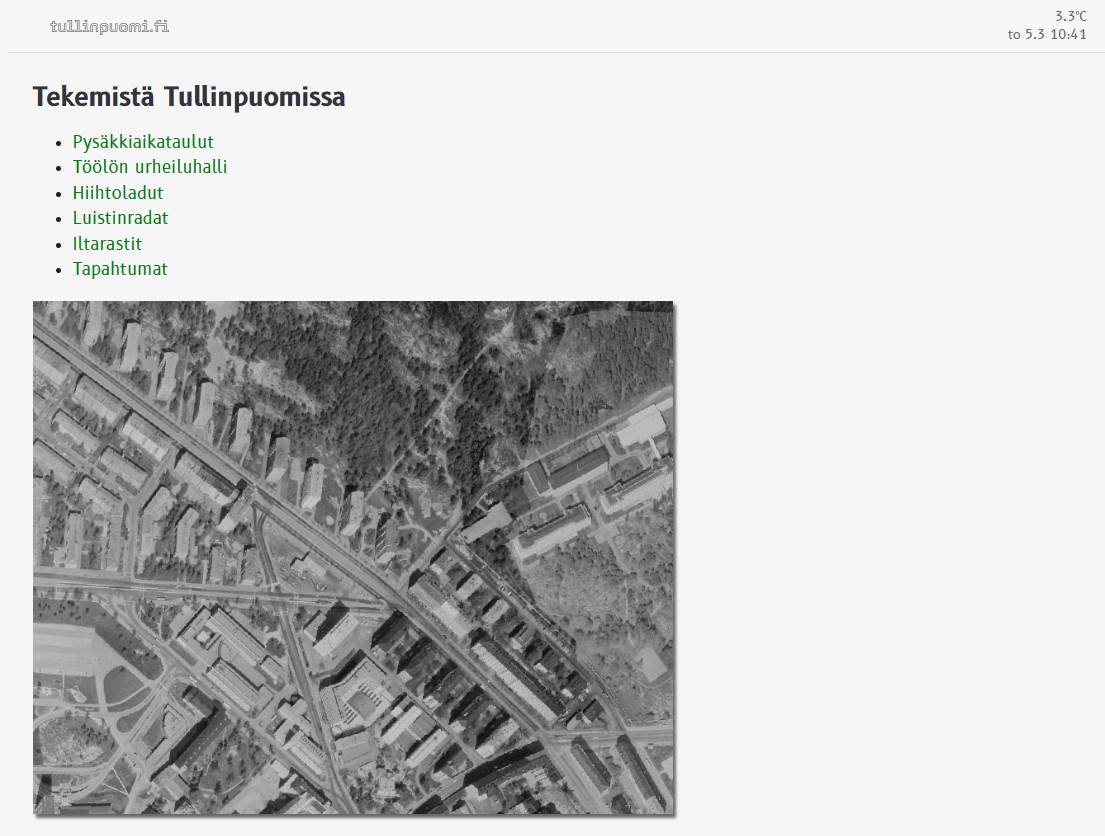
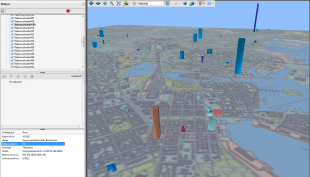
Historical Helsinki
8.12.2017 -
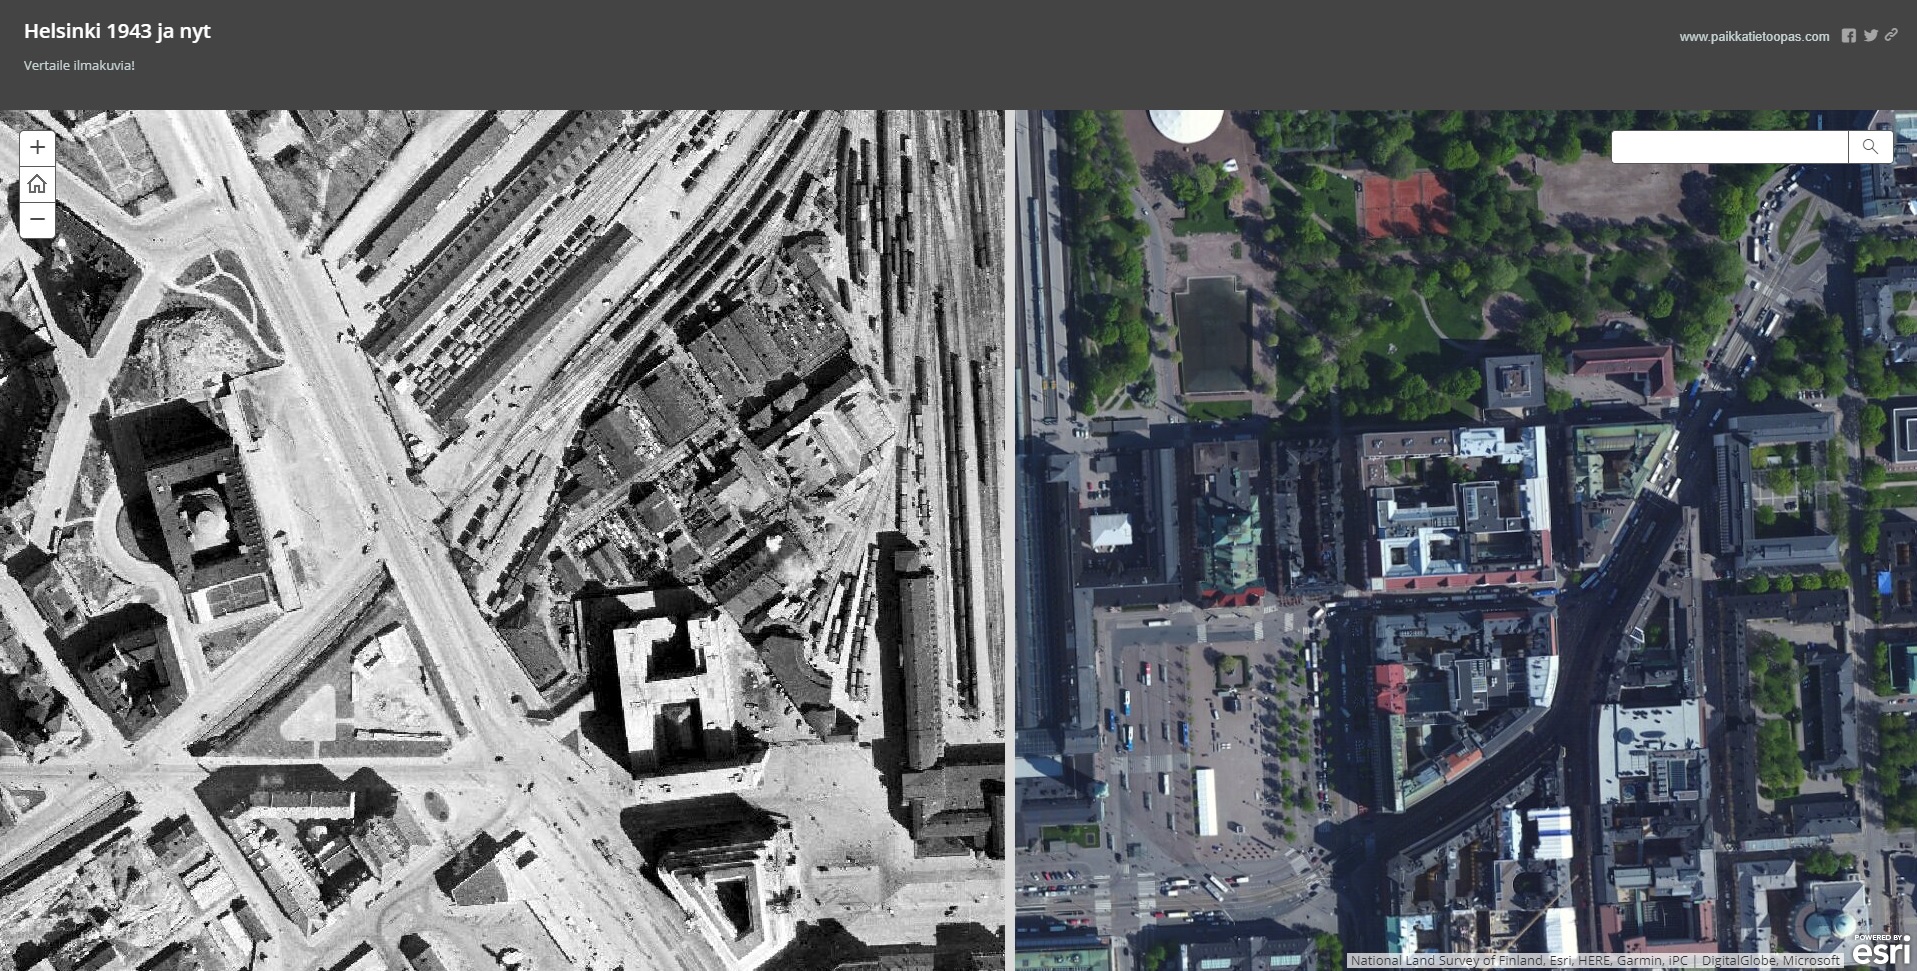
Helsinki 1943 ja nyt
8.12.2017 -
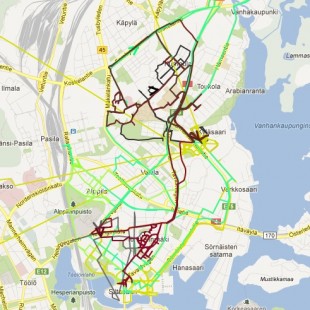
Lumiaurojen liike
8.12.2017 -
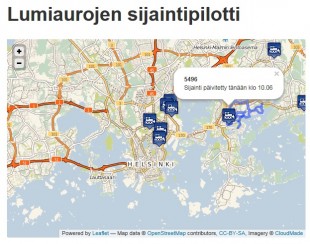
Lumiaurojen sijaintipilotti
8.12.2017 -
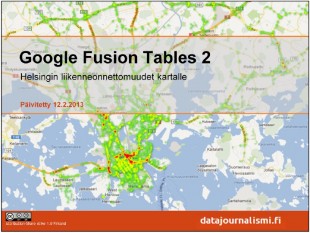
Google Fusion Tables -tutoriaali
8.12.2017 -
Helsingin kaupungin rakennushankkeet -sovellus
8.12.2017 -
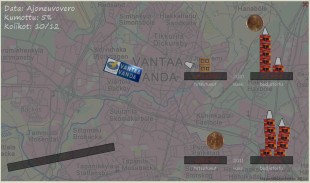
Budget Fall
8.12.2017 -
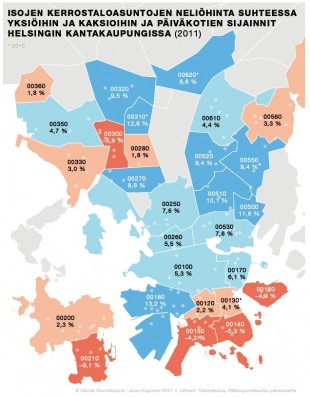
Asuntokuume: Täältä löytyy edullisin koti urbaanille lapsiperheelle
30.11.2017 -
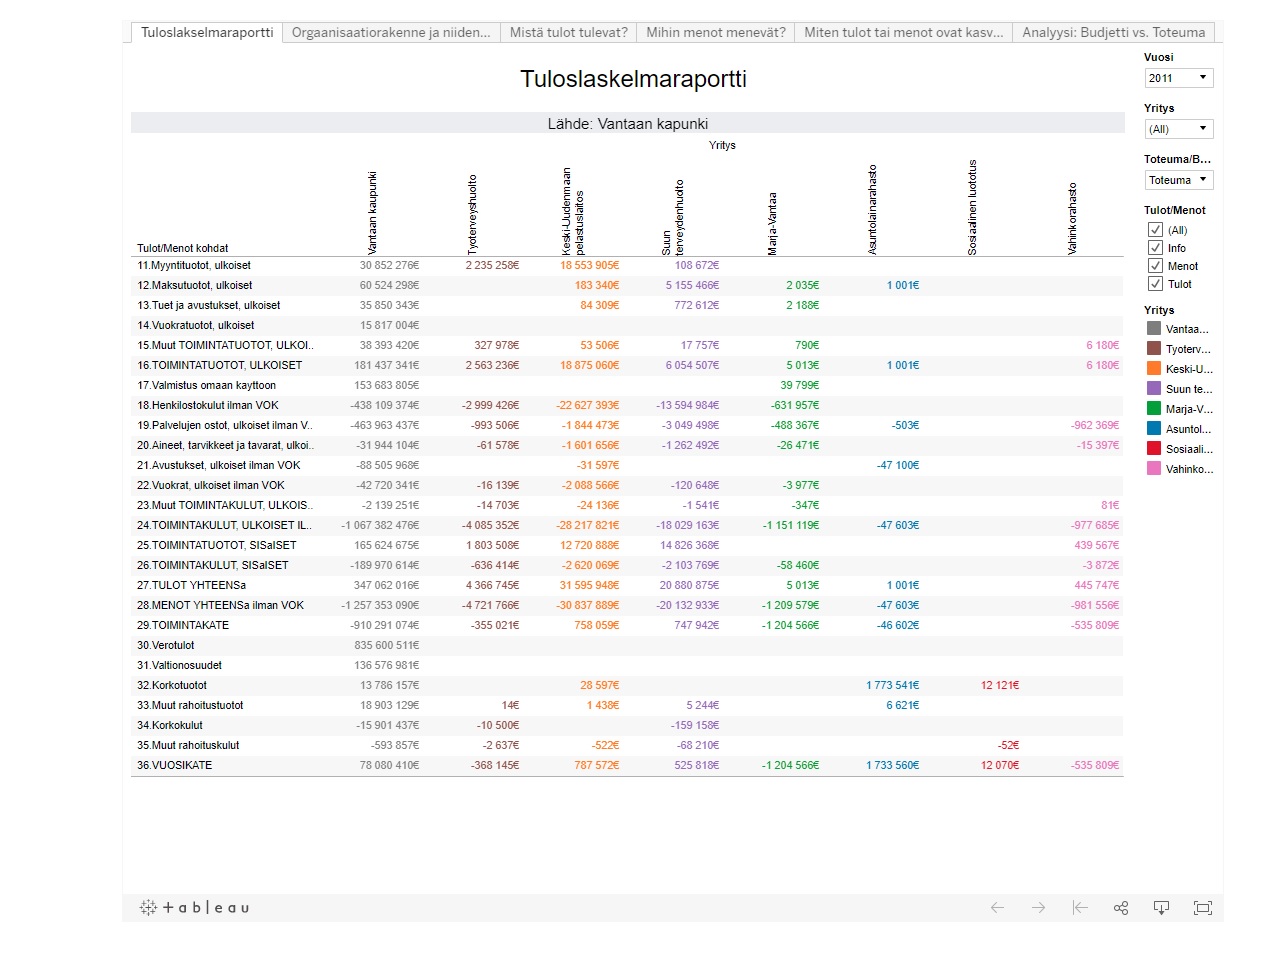
An analytical view on “Vantaan kaupungin tulot ja menot 2010–2011″ data
30.11.2017 -

Hypermarketien saavutettavuus julkisella liikenteellä pk-seudulla
30.11.2017 -
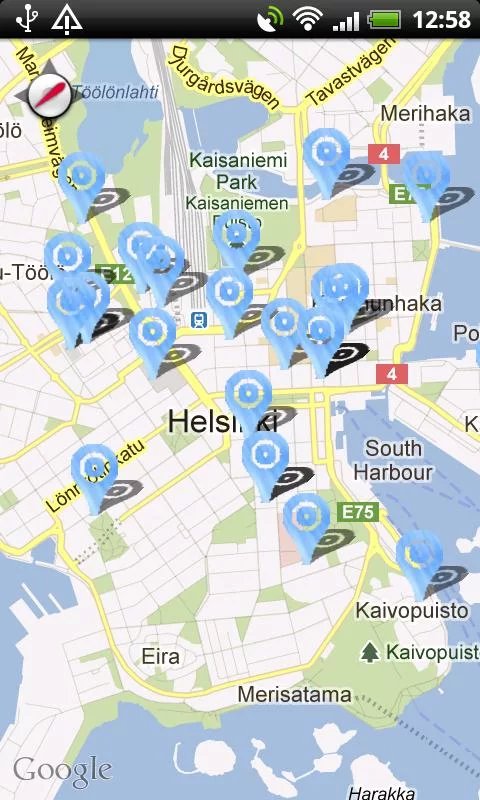
GoHelsinki
30.11.2017 -

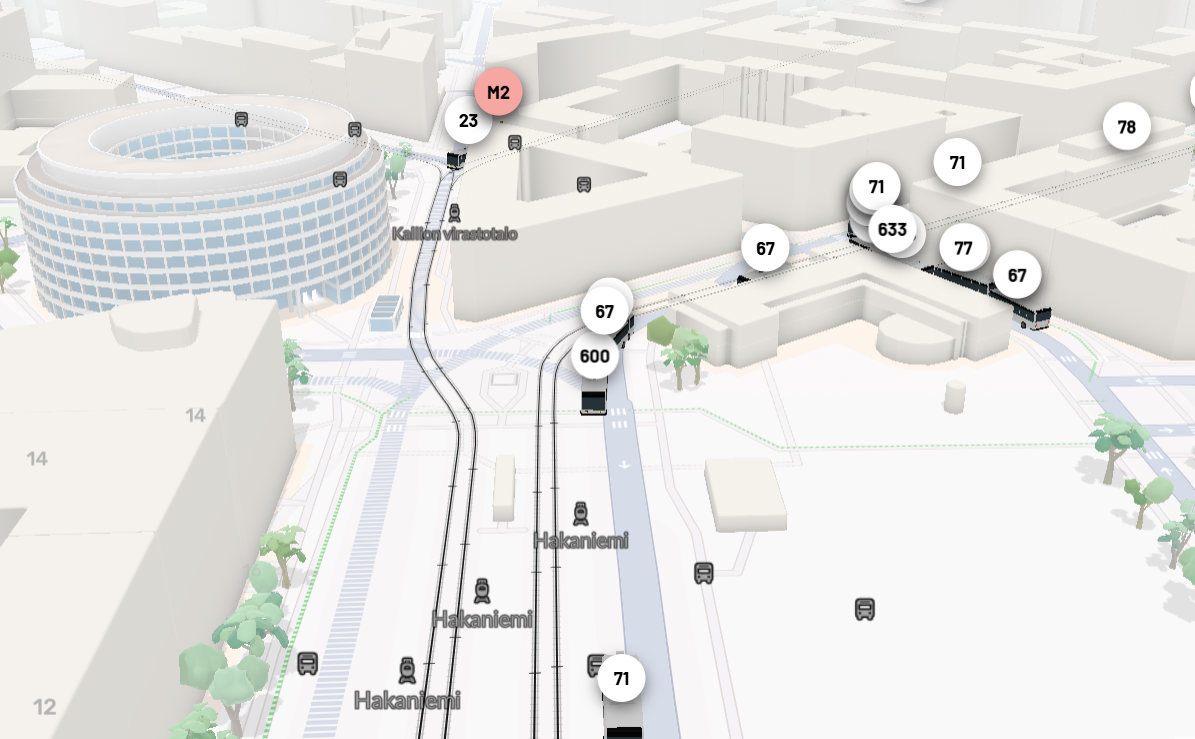
Reitit v2.0
30.11.2017 -

Nomadi
30.11.2017 -
ShareNav
30.11.2017