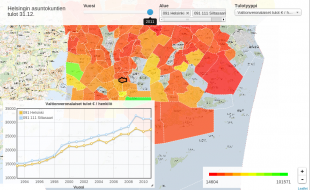

This visualization displays different variables in income distribution in Helsinki's districts using a colour coded map as well as a time series. Income distribution is fetched from the regional statistics API and is combined with area information from geoserver.hel.fi.
This application is open source code, available on Github.