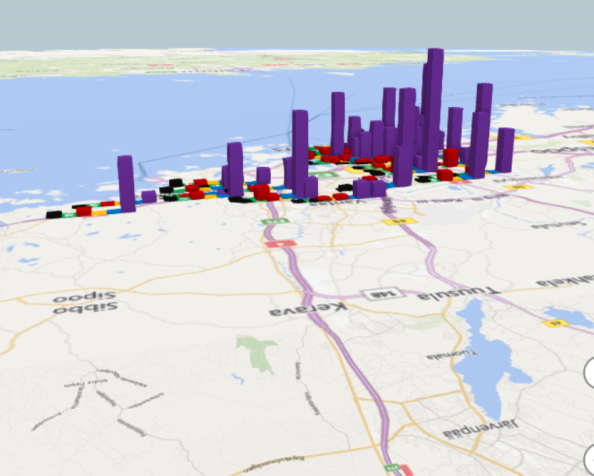
Helsingin liikennemäärät
Visualizations
Heidi Enho
-
Published 12.12.2017
-
Updated 15.1.2021