-
Avoimuuden aurinko
12.12.2017 -
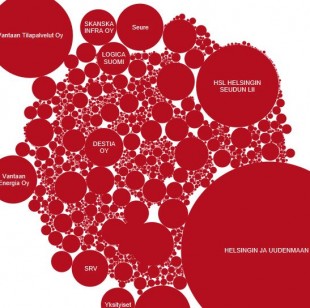
Vantaan kaupungin ostot 2012
12.12.2017 -

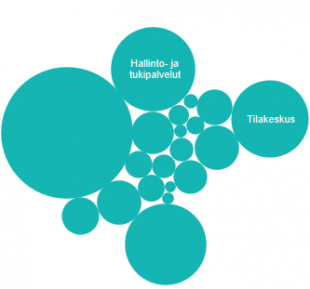
Espoon kaupungin ostot 2012
12.12.2017 -
Helsingin kaupungin ostot 2012-2013
12.12.2017 -
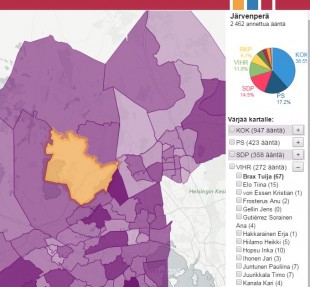
Espoon, Vantaan ja Kauniaisten äänet 2011
12.12.2017 -
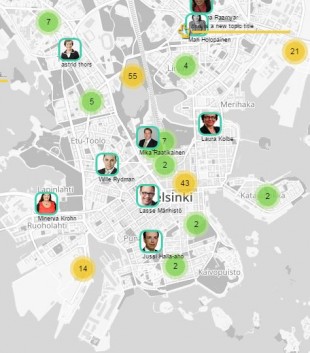
Topicalio
12.12.2017 -
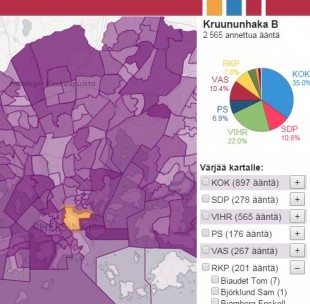
Helsingin äänet 2011
12.12.2017 -
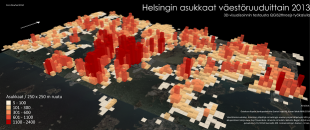
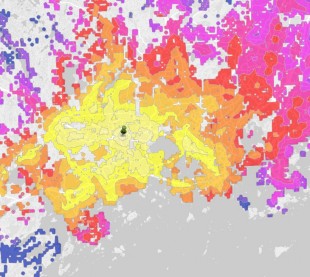
Väestötietoruudukon 3D-visualisointia
12.12.2017 -

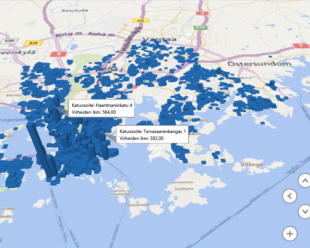
Matka-aikoja Hot Doge -ravintolaan
12.12.2017 -

Helsingin kaupungin ostot 2012-13
12.12.2017 -
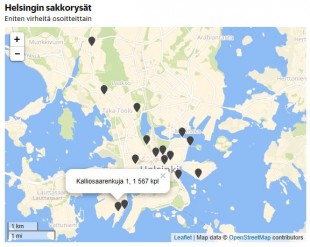
Helsingin sakkorysät
12.12.2017 -
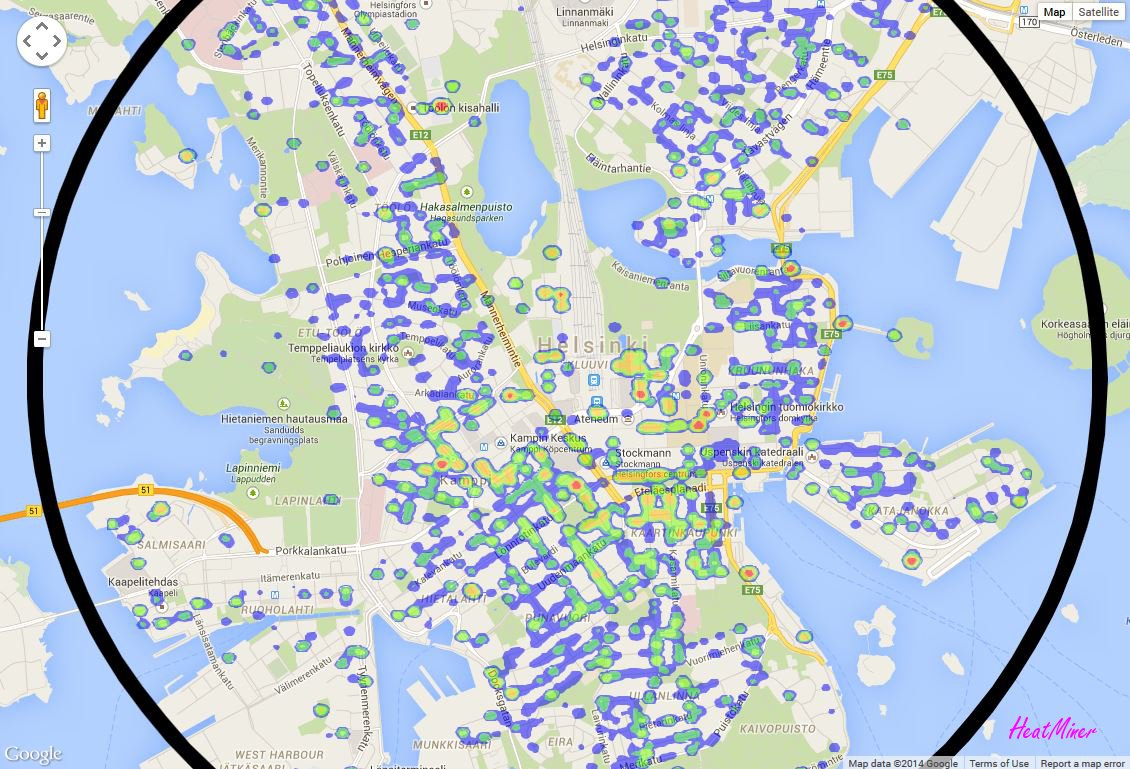
Väärin pysäköity!
12.12.2017 -
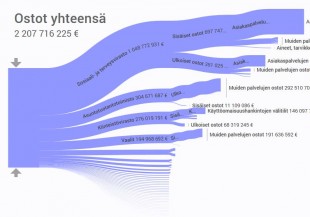
Helsingin kaupungin ostot -visualisointi
12.12.2017 -
Helsingin pysäköintivirheet
12.12.2017 -

Toimeentulotuen menot kasvavat rajusti Helsingissä
12.12.2017 -

Kuvapolut: Katajanokka – Töölö – Kallio
11.12.2017 -
Matka-aika Esrille aamulla
11.12.2017 -

Terdelaskuri
11.12.2017