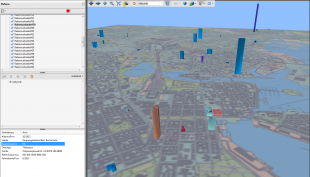
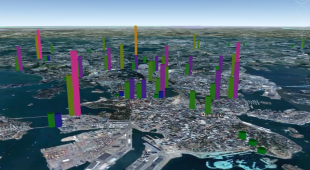
Liikennemäärien visualisointi

Lassi Tani - Published 29.11.2017 - Updated 11.12.2017
  1. 2017-11-29-071440.380683liikennemaarienvisualisointiscreenshot-310x170.png

Helsinki's traffic volume visualized on Google Earth. Every monitoring point is visualized by two pillars, from which the left one represents outbound traffic from the city and the right one inbound traffic towards the city. By using Google Earth's time slider it is possible to see how traffic volumes are affected by time of day. The time slide also has an animation mode.

Used datasets

comments powered by Disqus