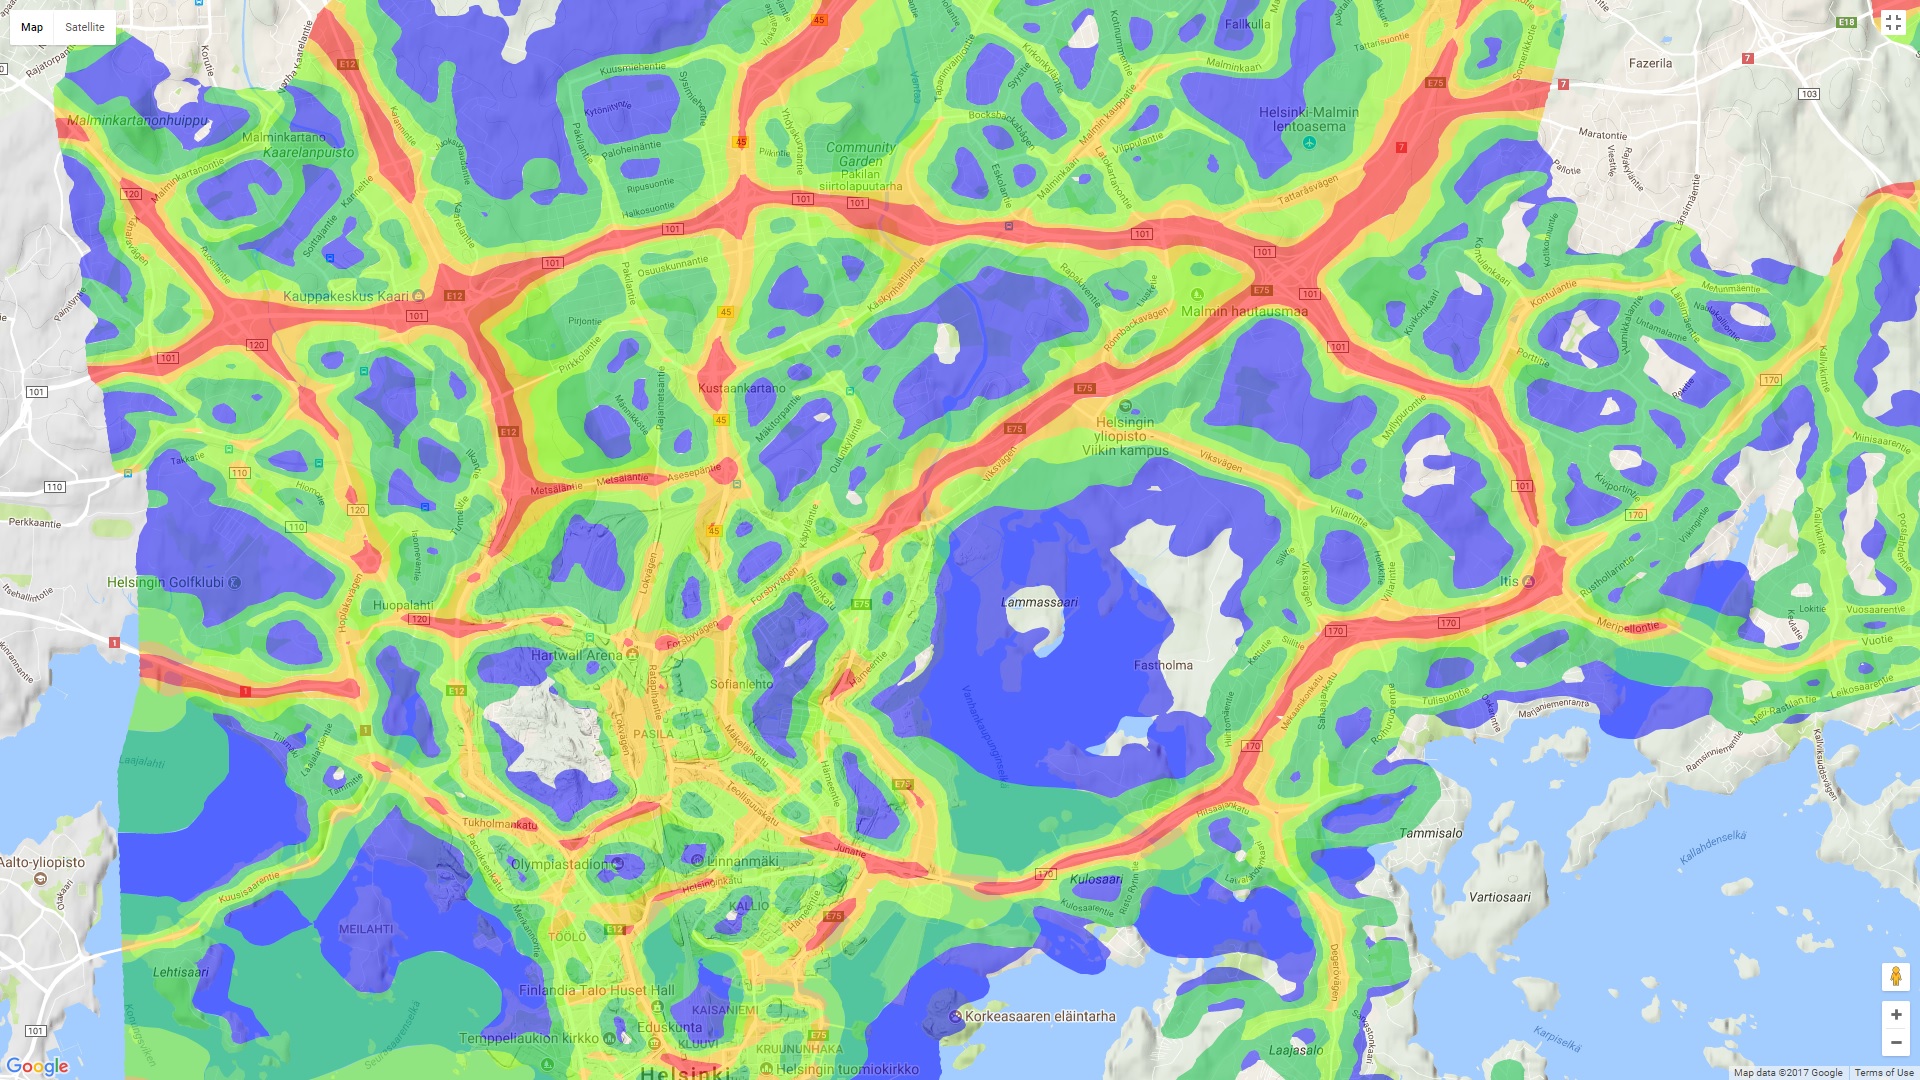
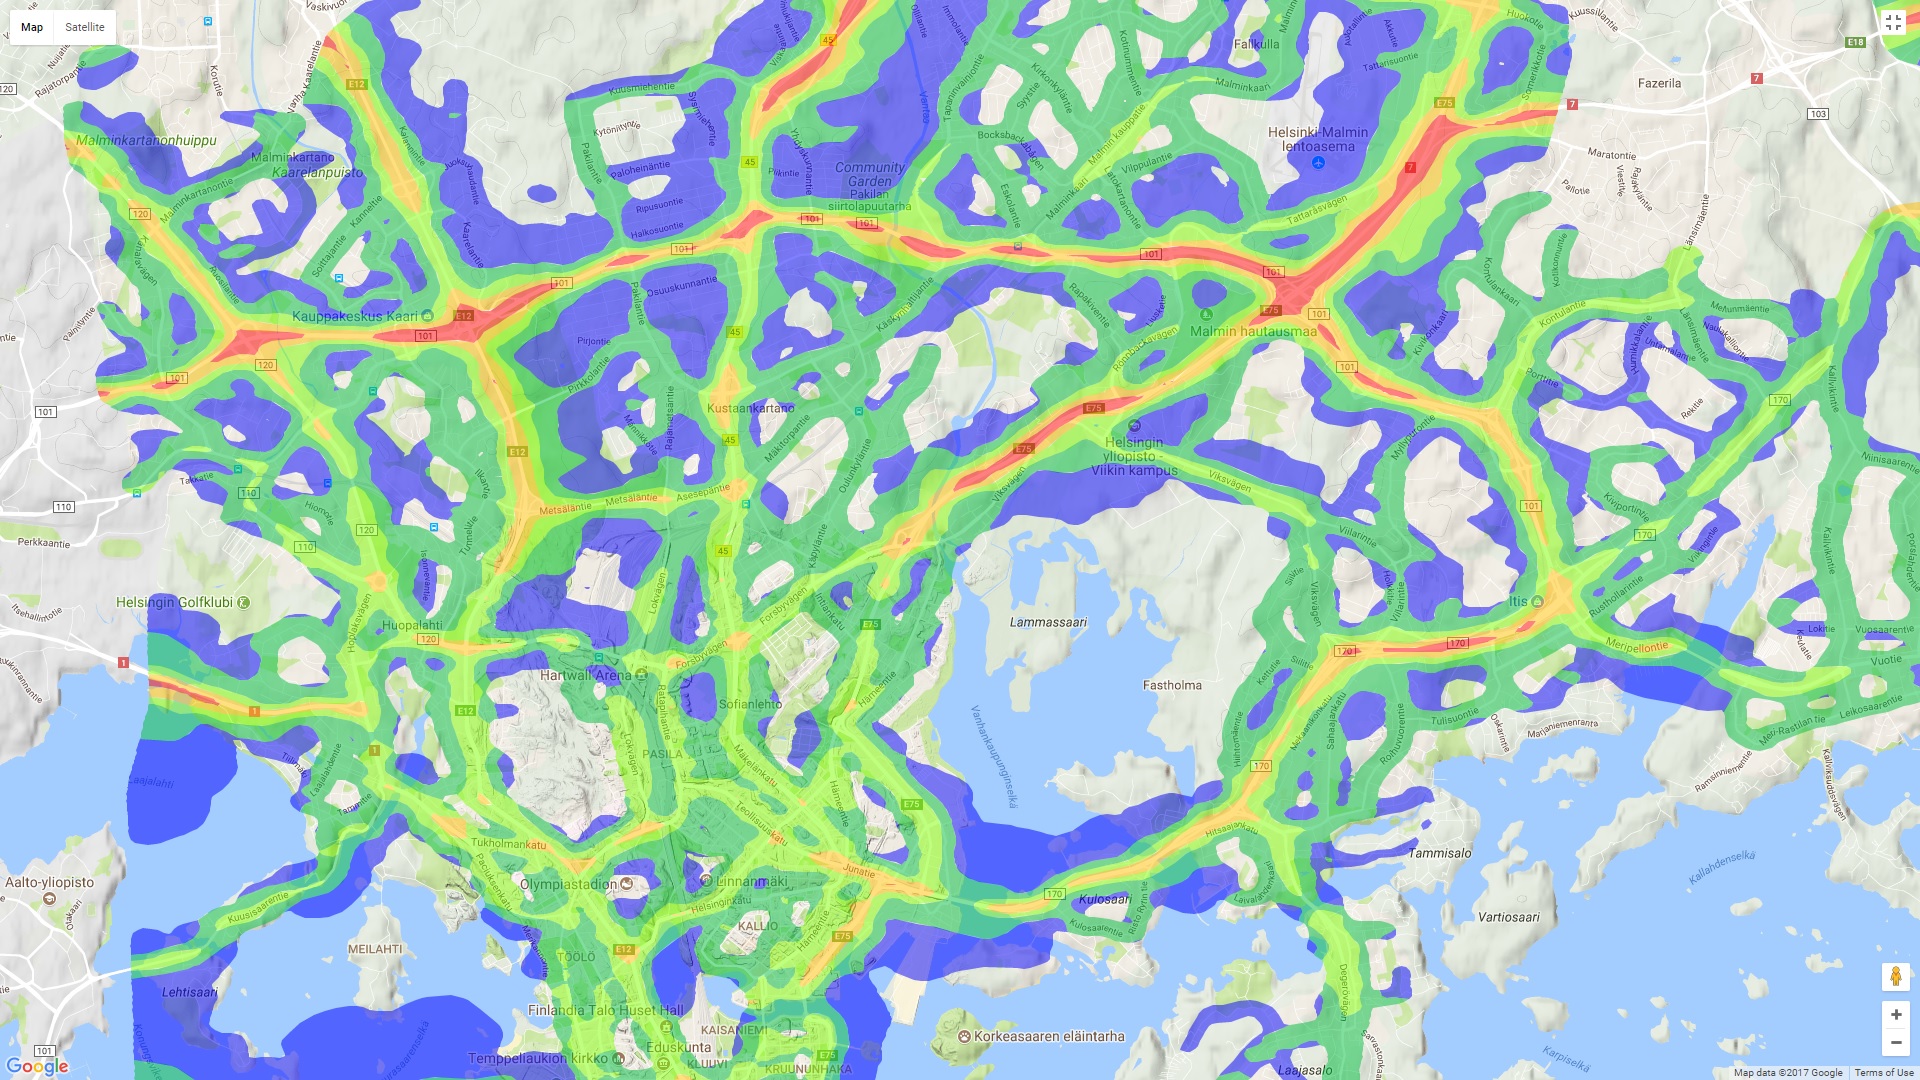
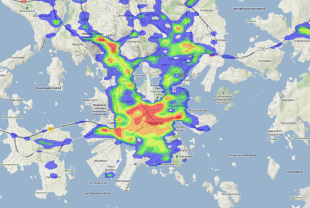
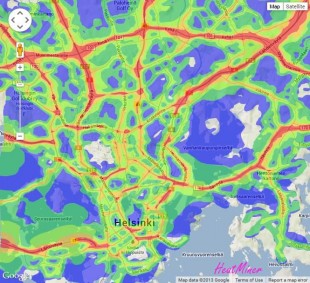
Direct link to content
  • Frontpage
  • Data
    • Search data
    • New data request
    • Categories
    • Organizations
    • Data collections
  • Showcases
    • All showcases
    • Submit new showcase
    • New showcase idea
  • News
    • Articles
    • Latest updates
  • Support
    • What is open data?
    • How to open data?
    • How to use data?
  • What is HRI?
    • What is HRI?
    • Materials and logos
    • Analytics
    • Contact information
  • FI
  • EN
  • SV
Helsinki • Espoo Site logo Vantaa • Kauniainen
Helsinki • Espoo • Vantaa • Kauniainen
  1. Frontpage
  2. Showcases
  3. Tieliikenteen melutasot Helsingissä

Tieliikenteen melutasot Helsingissä

Visualizations
  • traffic
  • noise
Cloud'N'Sci Oy - Published 11.12.2017 - Updated 11.12.2017
  1. 2017-12-11-070231.752404trafficnoise1.jpg
  2. 2017-12-11-070231.753203trafficnoise2.jpg

This visualization is a heat map of traffic noise in Helsinki, embedded on top of Google Maps. It is a simple and lightweight visual aid in discovering traffic noise levels across Helsinki.

Used datasets

  • Traffic noise zones in Helsinki metropolitan area

    The data includes traffic noise zones in the Helsinki metropolitan area (Helsinki, Espoo, Vantaa and Kauniainen). The dataset contains a breakdown of road and rail traffic noise...
    • SHP

By the same author

  • Väärin pysäköity!

  • Heatmaps4Finland

  • Liikenneonnettomuuksien tiheys lämpökarttana

Show all
Showcase website arrow_forward Author website arrow_forward

By the same author

  • Väärin pysäköity!

  • Heatmaps4Finland

  • Liikenneonnettomuuksien tiheys lämpökarttana

Show all
  • Data portal arrow_forward
  • Content management arrow_forward
Site logo
Follow us

  • Terms and conditions
  • Data Protection
  • Contact information
  • Accessibility (in Finnish)