Kunnallisvaalit Helsingissä

Jasmina Savolainen - Published 11.12.2017 - Updated 11.12.2017
  1. 2017-12-11-104715.006519kunnallisvaalithgissa.jpg

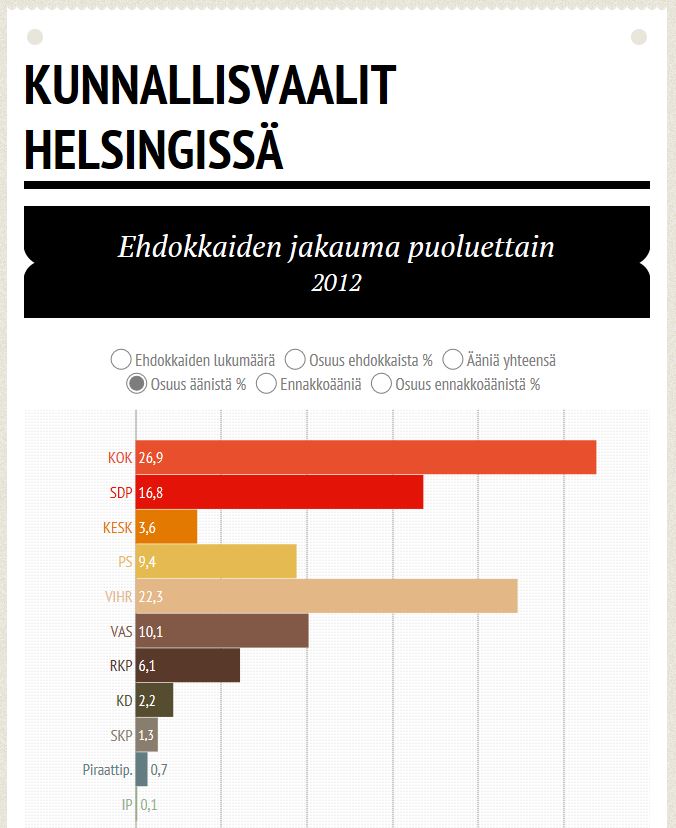
An infogram visualization of the Helsinki municipal elections. The upper visualization shows the difference between the number of candidates of each political party. The bottom visualization shows i.e. the gender distribution of voters during different years.

Used datasets

comments powered by Disqus