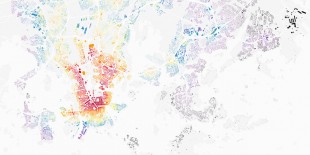
"When I was buying a new apartment in Helsinki, I really wanted to optimise the location. I work as a consultant so I want to be able to move around as effortlessly as possible. So I did my own analysis: I calculated the travel time from every address to every other address in Helsinki around 7:30-8:00 am (about 30 billion searches total!). Then I calculated the (weighted) average travel time to anywhere in the city, using the number of jobs in the target area as weight. I didn’t stop there. I already had a software that could quickly analyze the travel times in Helsinki so why not try to optimise the location based on the pubs that serve good beer! I used a list of “top 20 beer bars”, and created a map that displays the average travel time to home after closing time 1:30 am.
These are the results, your welcome!"
Read the complete blog about this visualization.