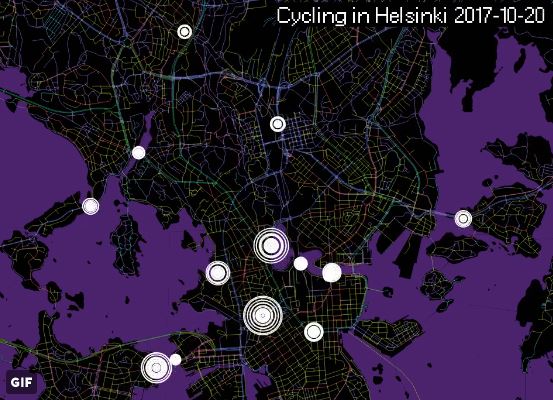
Direct link to content
  • Frontpage
  • Data
    • Search data
    • New data request
    • Categories
    • Organizations
    • Data collections
  • Showcases
    • All showcases
    • Submit new showcase
    • New showcase idea
  • News
    • Articles
    • Latest updates
  • Support
    • What is open data?
    • How to open data?
    • How to use data?
  • What is HRI?
    • What is HRI?
    • Materials and logos
    • Analytics
    • Contact information
  • FI
  • EN
  • SV
Helsinki • Espoo Site logo Vantaa • Kauniainen
Helsinki • Espoo • Vantaa • Kauniainen
  1. Frontpage
  2. Showcases
  3. Cycling in Helsinki

Cycling in Helsinki

Visualisations
Topi Tjukanov - Published 3.4.2018 - Updated 3.4.2018
  1. 2018-04-03-095935.472328CyclinginHelsinki.JPG

Measured bicycle traffic in Helsinki for each day of last year [2017]. Each point is a measurement point and the size of the marker is relative to the number of cyclists driving past that point.

Used datasets

  • Number of cyclists in Helsinki

    There are two datasets available on cycling in Helsinki: hourly and annual Hourly dataset Helsinki cyclist counts per hour from the beginning of 2014. The number of cyclists is...
    • XLSX
    • CSV
    • WFS

By the same author

  • Helsingin seudun julkinen liikenne

  • Pääkaupunkiseudun rakennusten ikä

  • Expansion of Helsinki

  • Porottaa – terassibongari

Show all
Showcase website arrow_forward Author website arrow_forward

By the same author

  • Helsingin seudun julkinen liikenne

  • Pääkaupunkiseudun rakennusten ikä

  • Expansion of Helsinki

  • Porottaa – terassibongari

Show all
  • Data portal arrow_forward
  • Content management arrow_forward
Site logo
Follow us

  • Terms and conditions
  • Data Protection
  • Contact information
  • Accessibility (in Finnish)