-
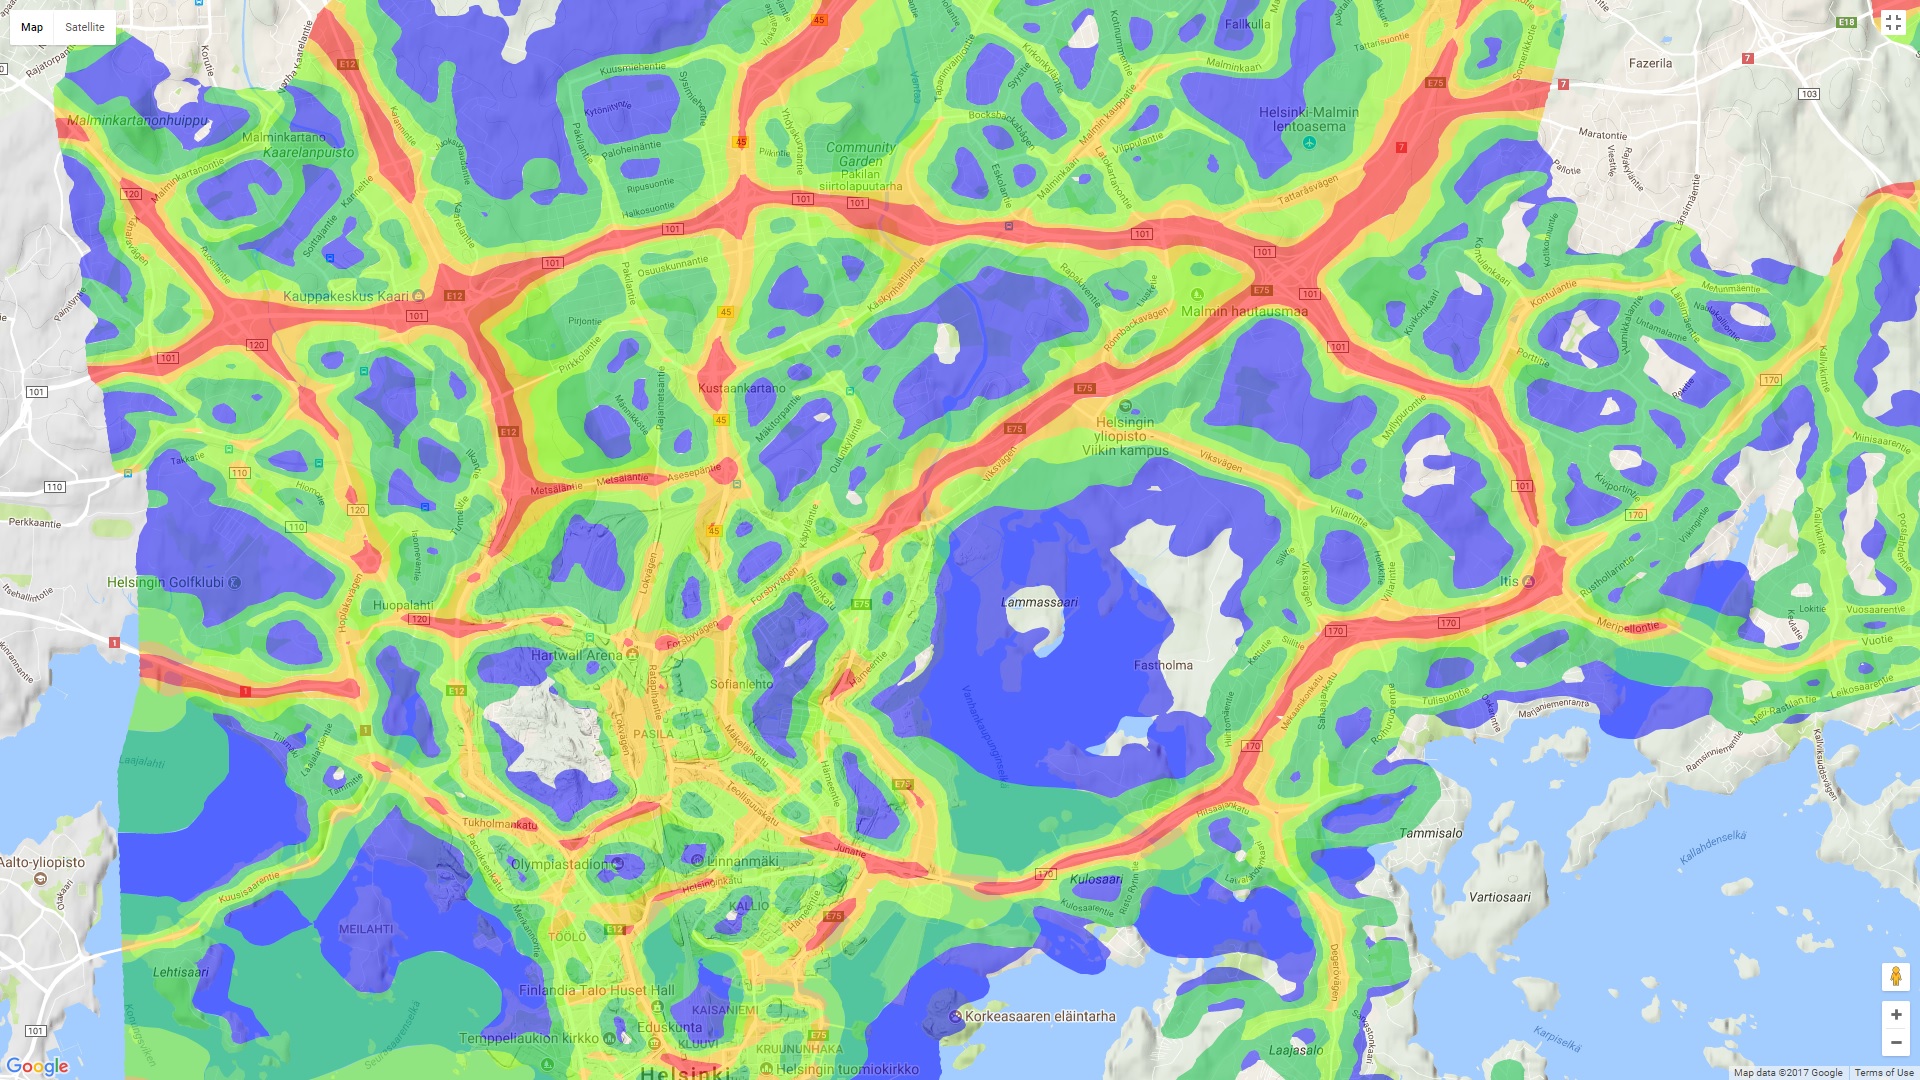
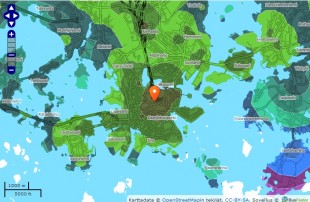
Tieliikenteen melutasot Helsingissä
11.12.2017 -

Helsinki by Age in Google Maps
8.12.2017 -
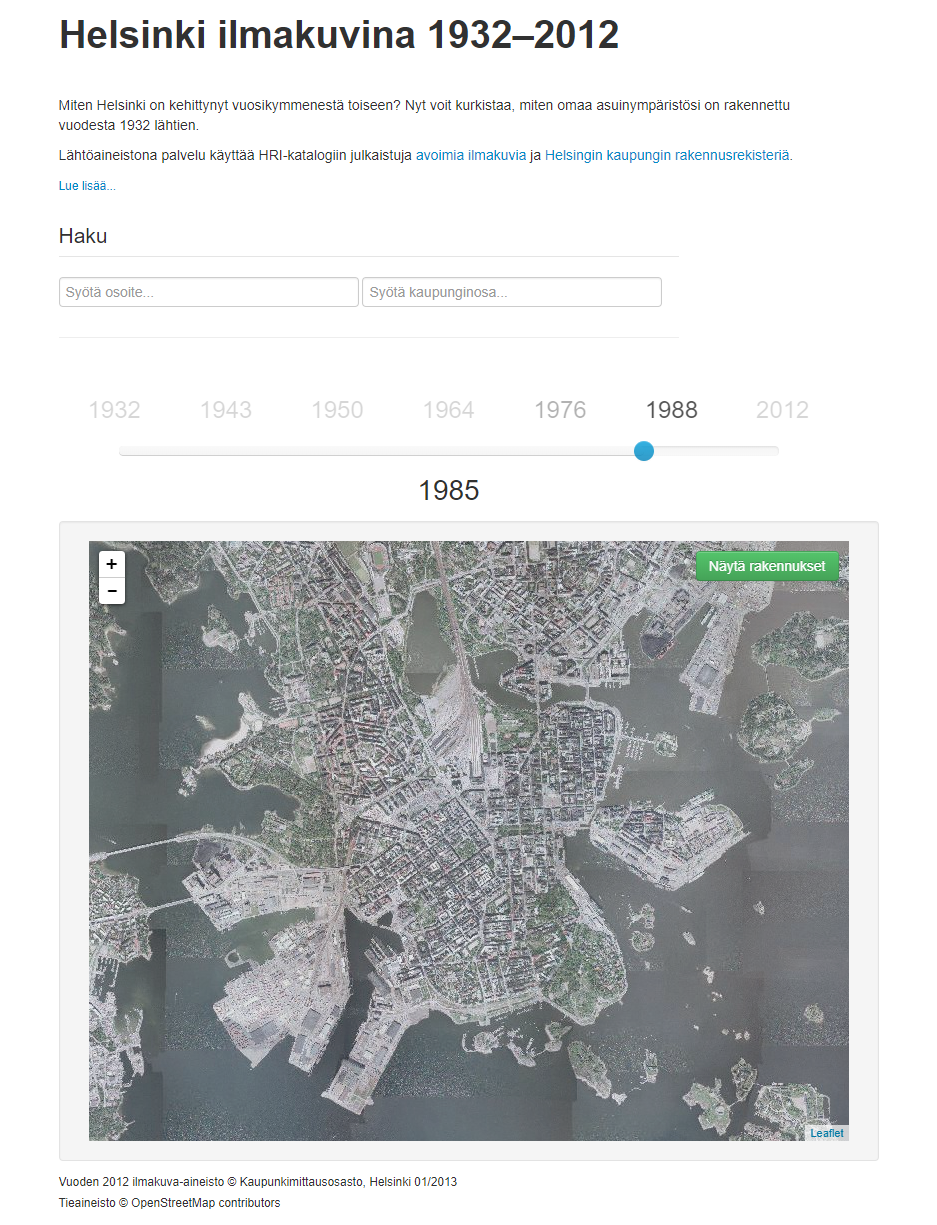
Helsinki ilmakuvina 1932 alkaen
8.12.2017 -
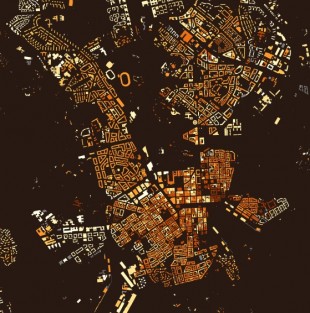
Helsinki by Age
8.12.2017 -
Raidemelu
8.12.2017 -
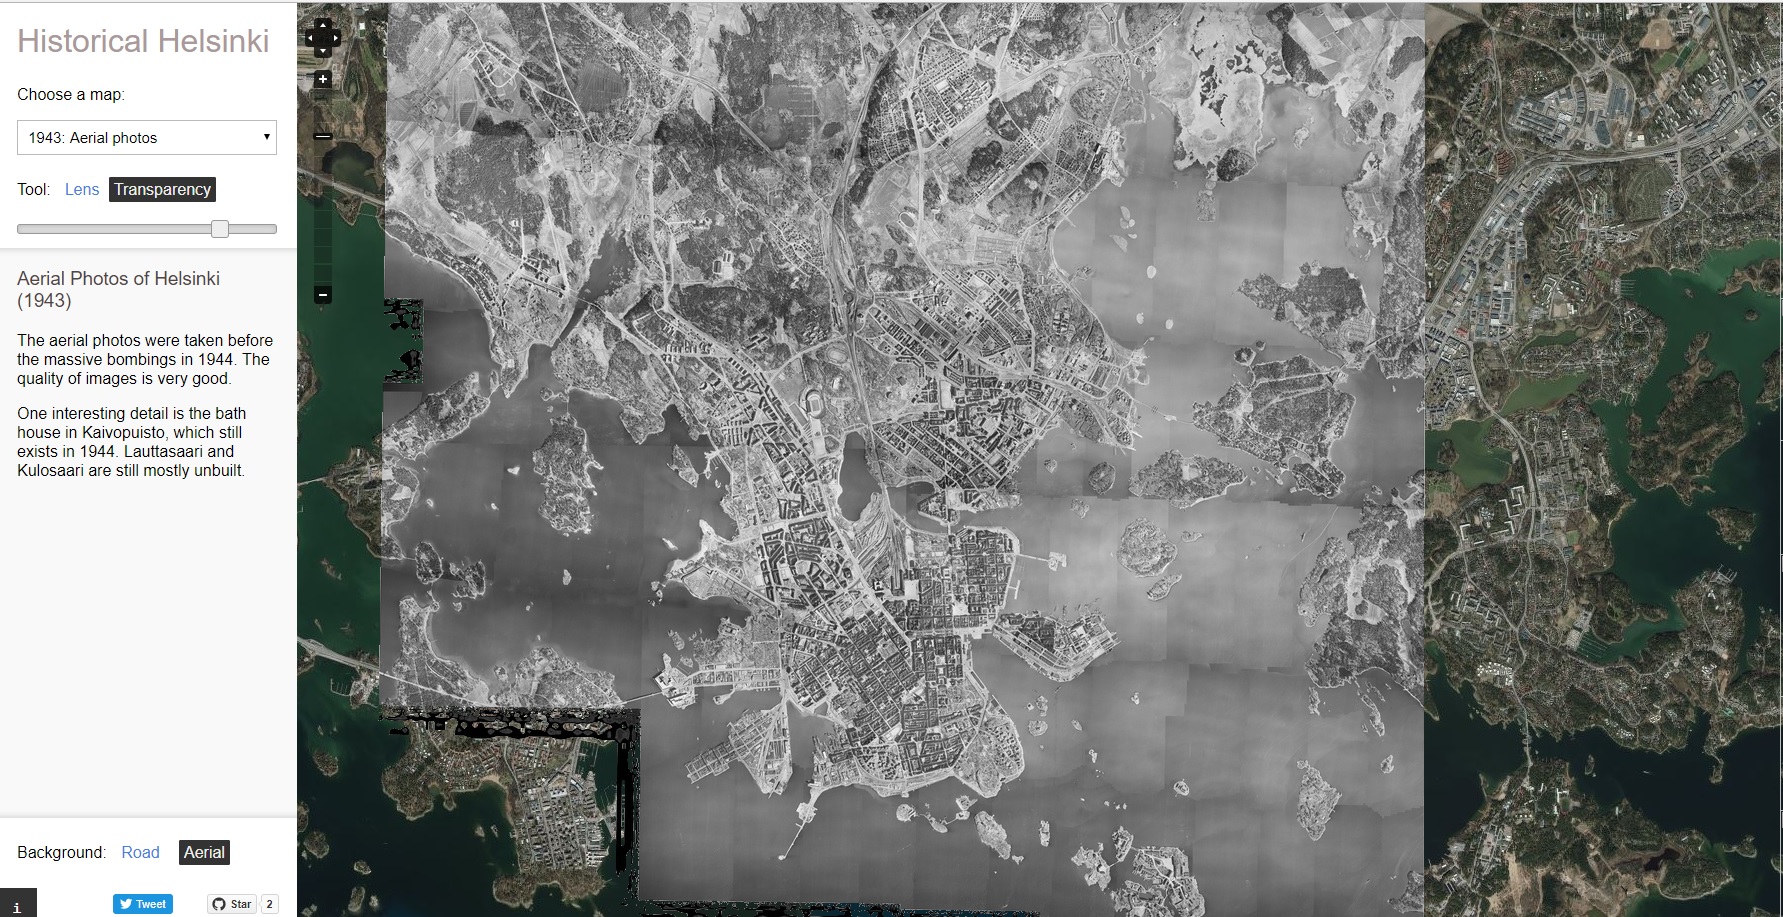
Historical Helsinki
8.12.2017 -
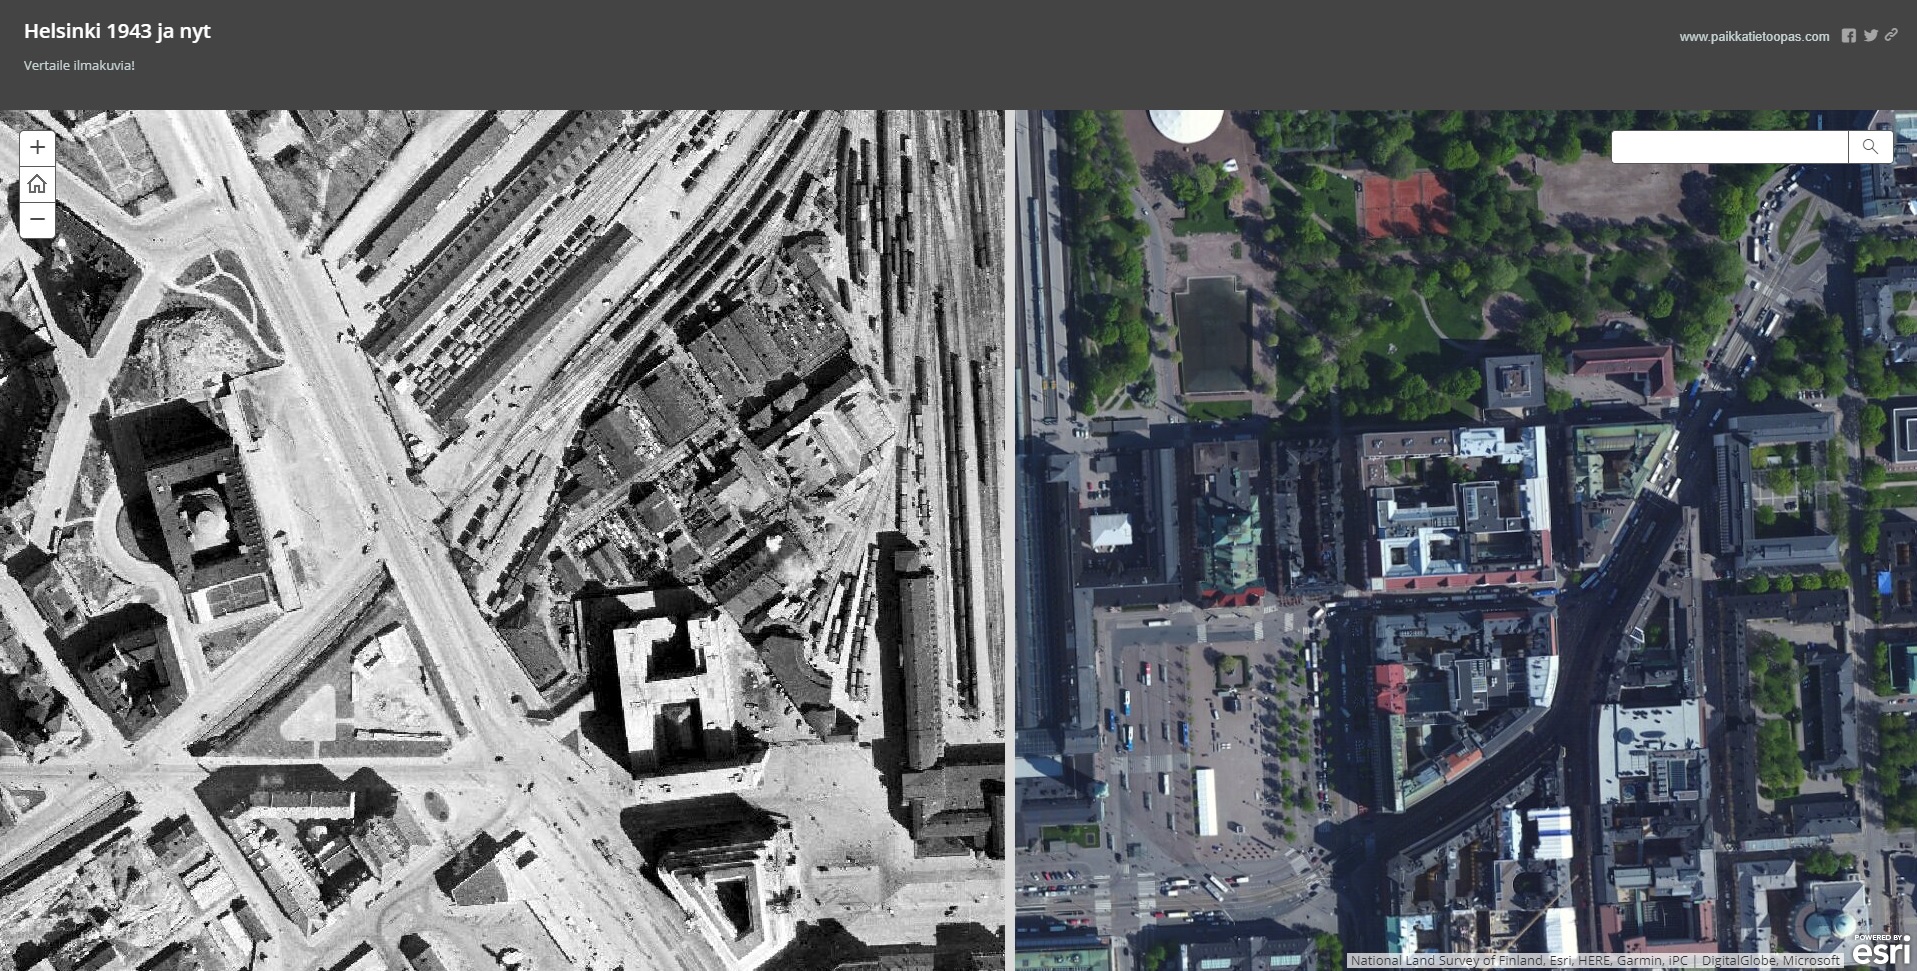
Helsinki 1943 ja nyt
8.12.2017 -
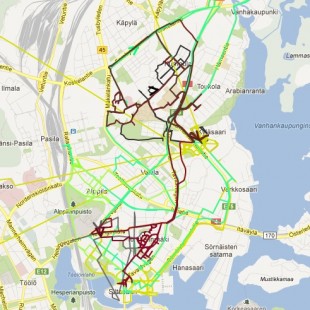
Lumiaurojen liike
8.12.2017 -
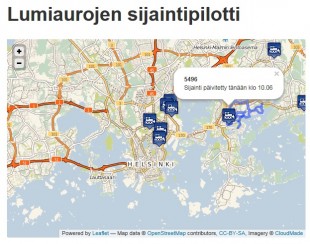
Lumiaurojen sijaintipilotti
8.12.2017 -
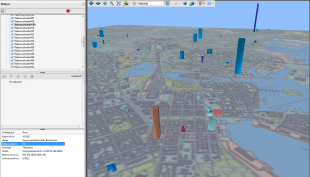
Helsingin kaupungin rakennushankkeet -sovellus
8.12.2017 -
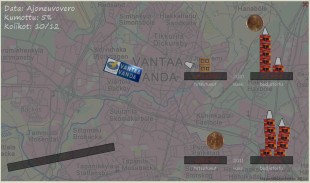
Budget Fall
8.12.2017 -
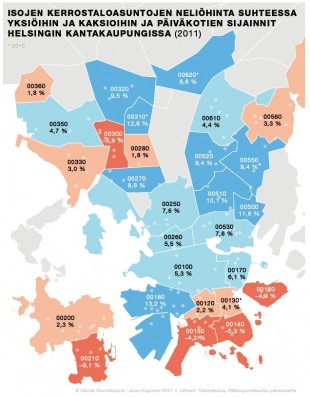
Asuntokuume: Täältä löytyy edullisin koti urbaanille lapsiperheelle
30.11.2017 -
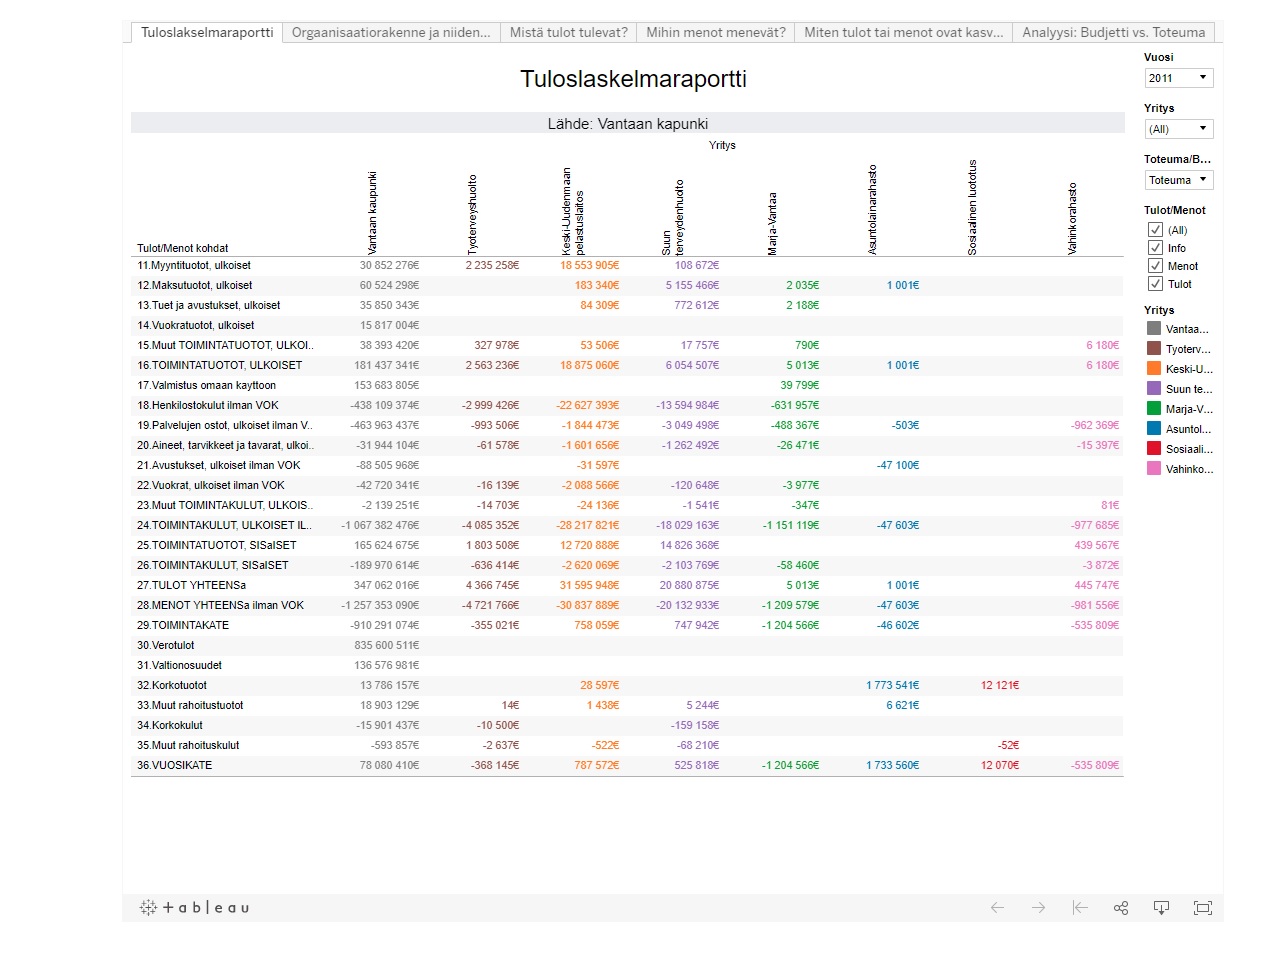
An analytical view on “Vantaan kaupungin tulot ja menot 2010–2011″ data
30.11.2017 -

Hypermarketien saavutettavuus julkisella liikenteellä pk-seudulla
30.11.2017 -
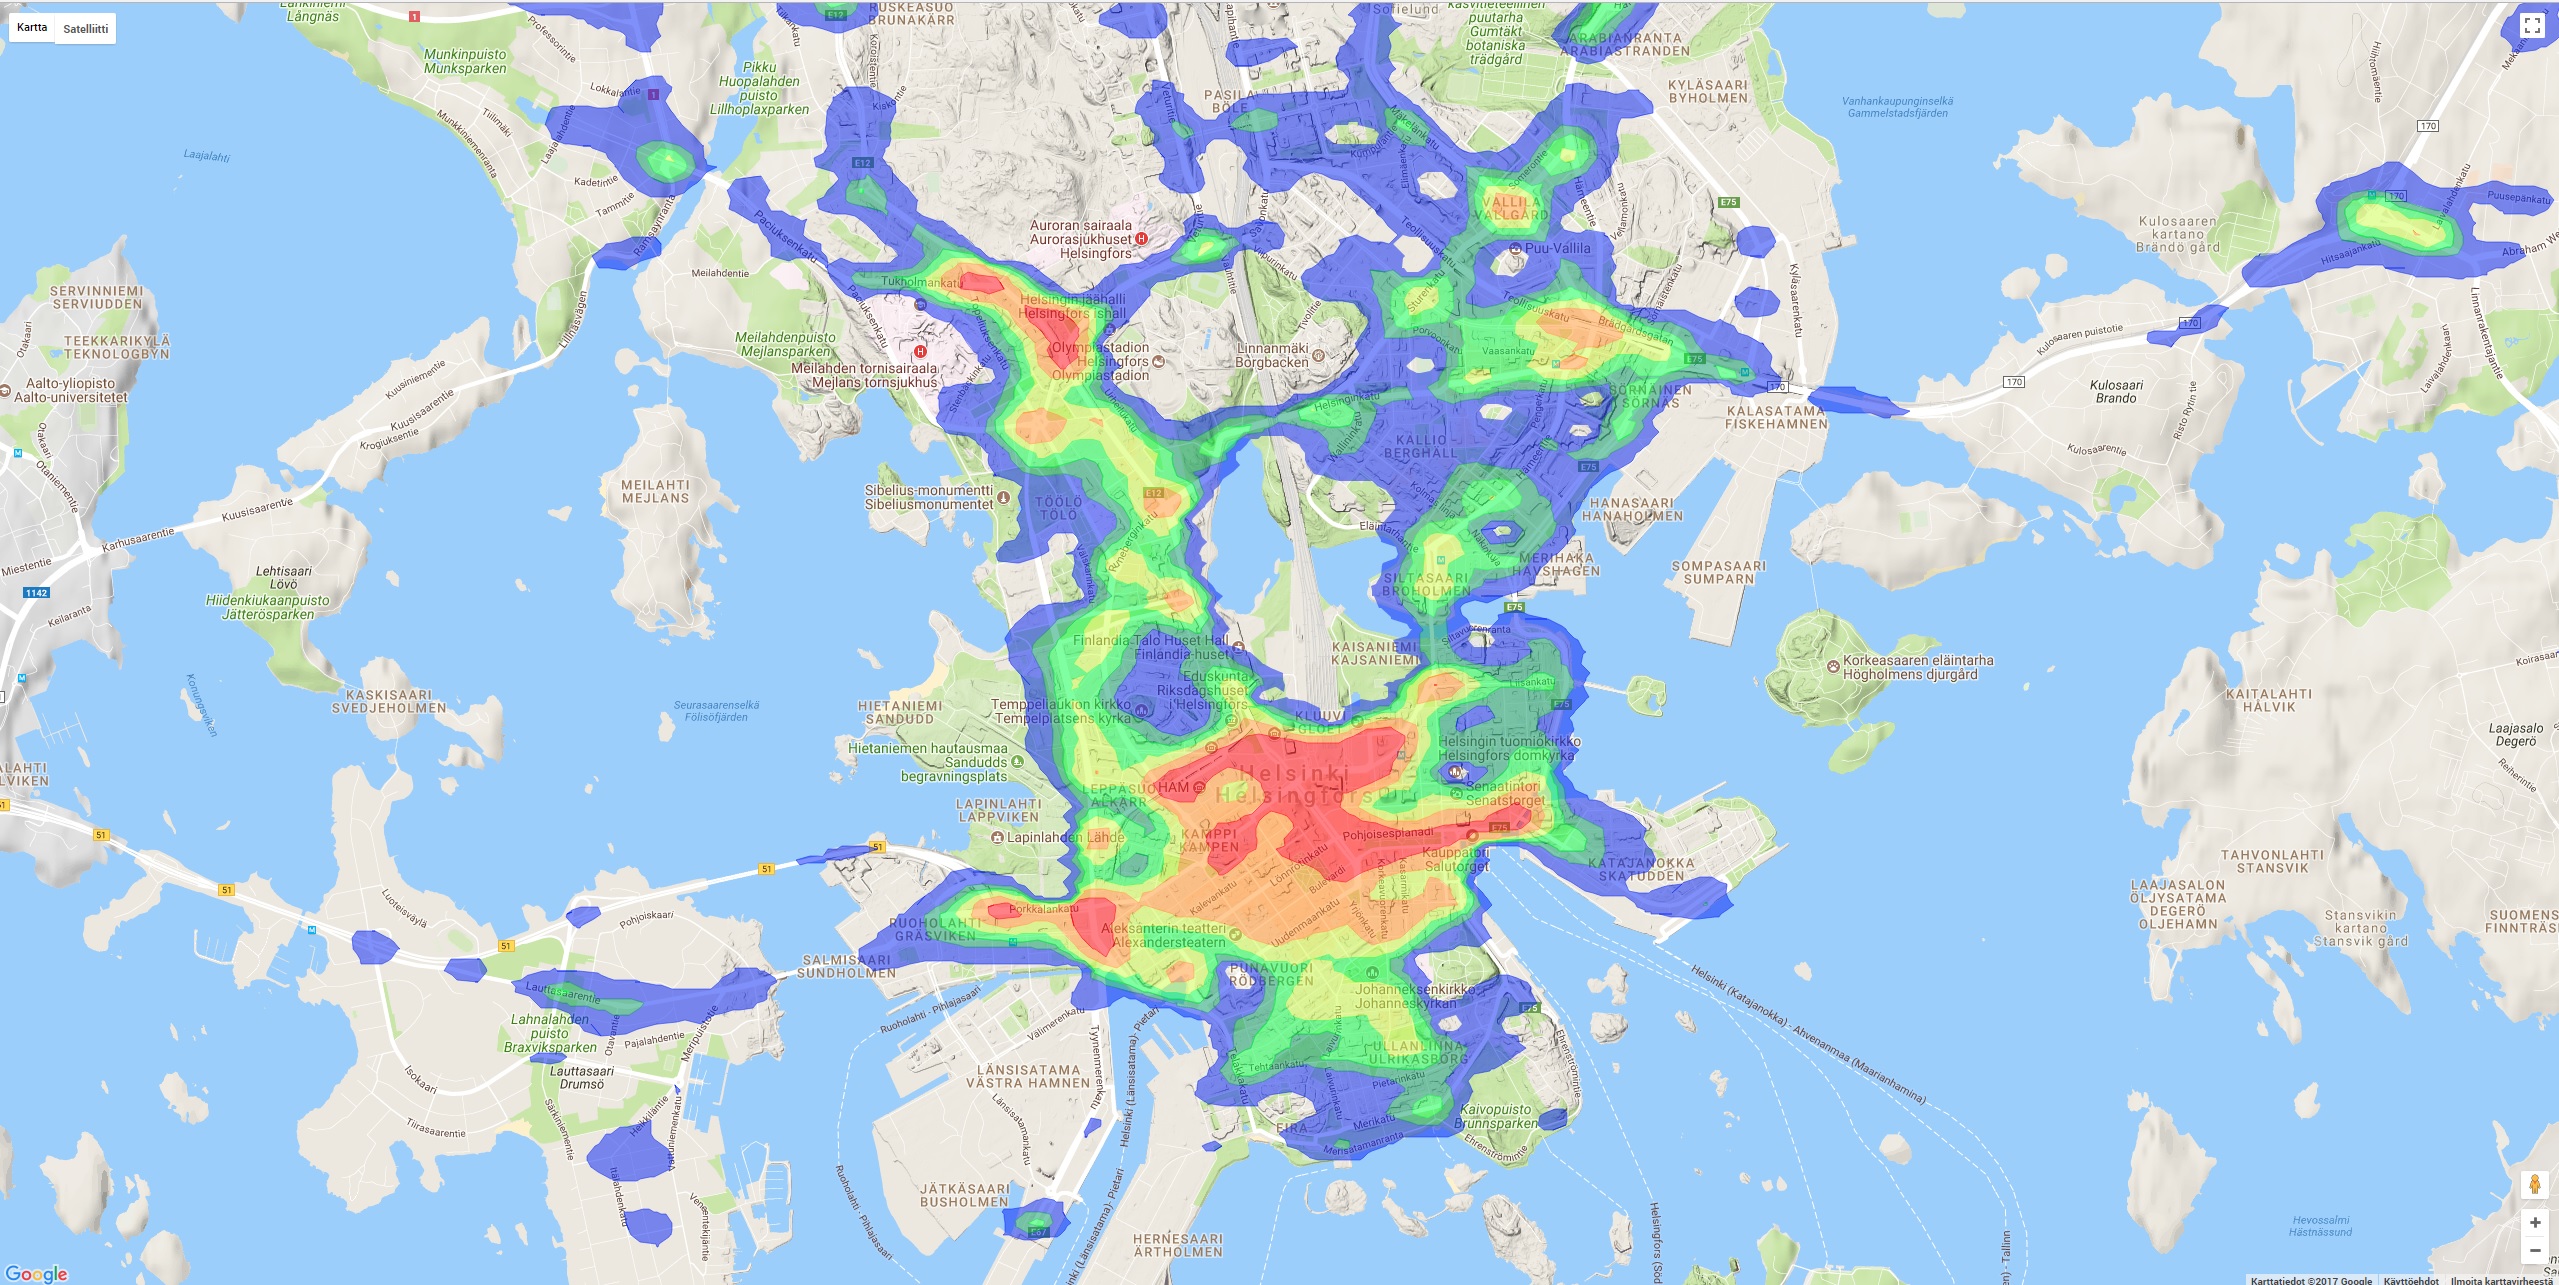
Matka-aikakartta
29.11.2017 -
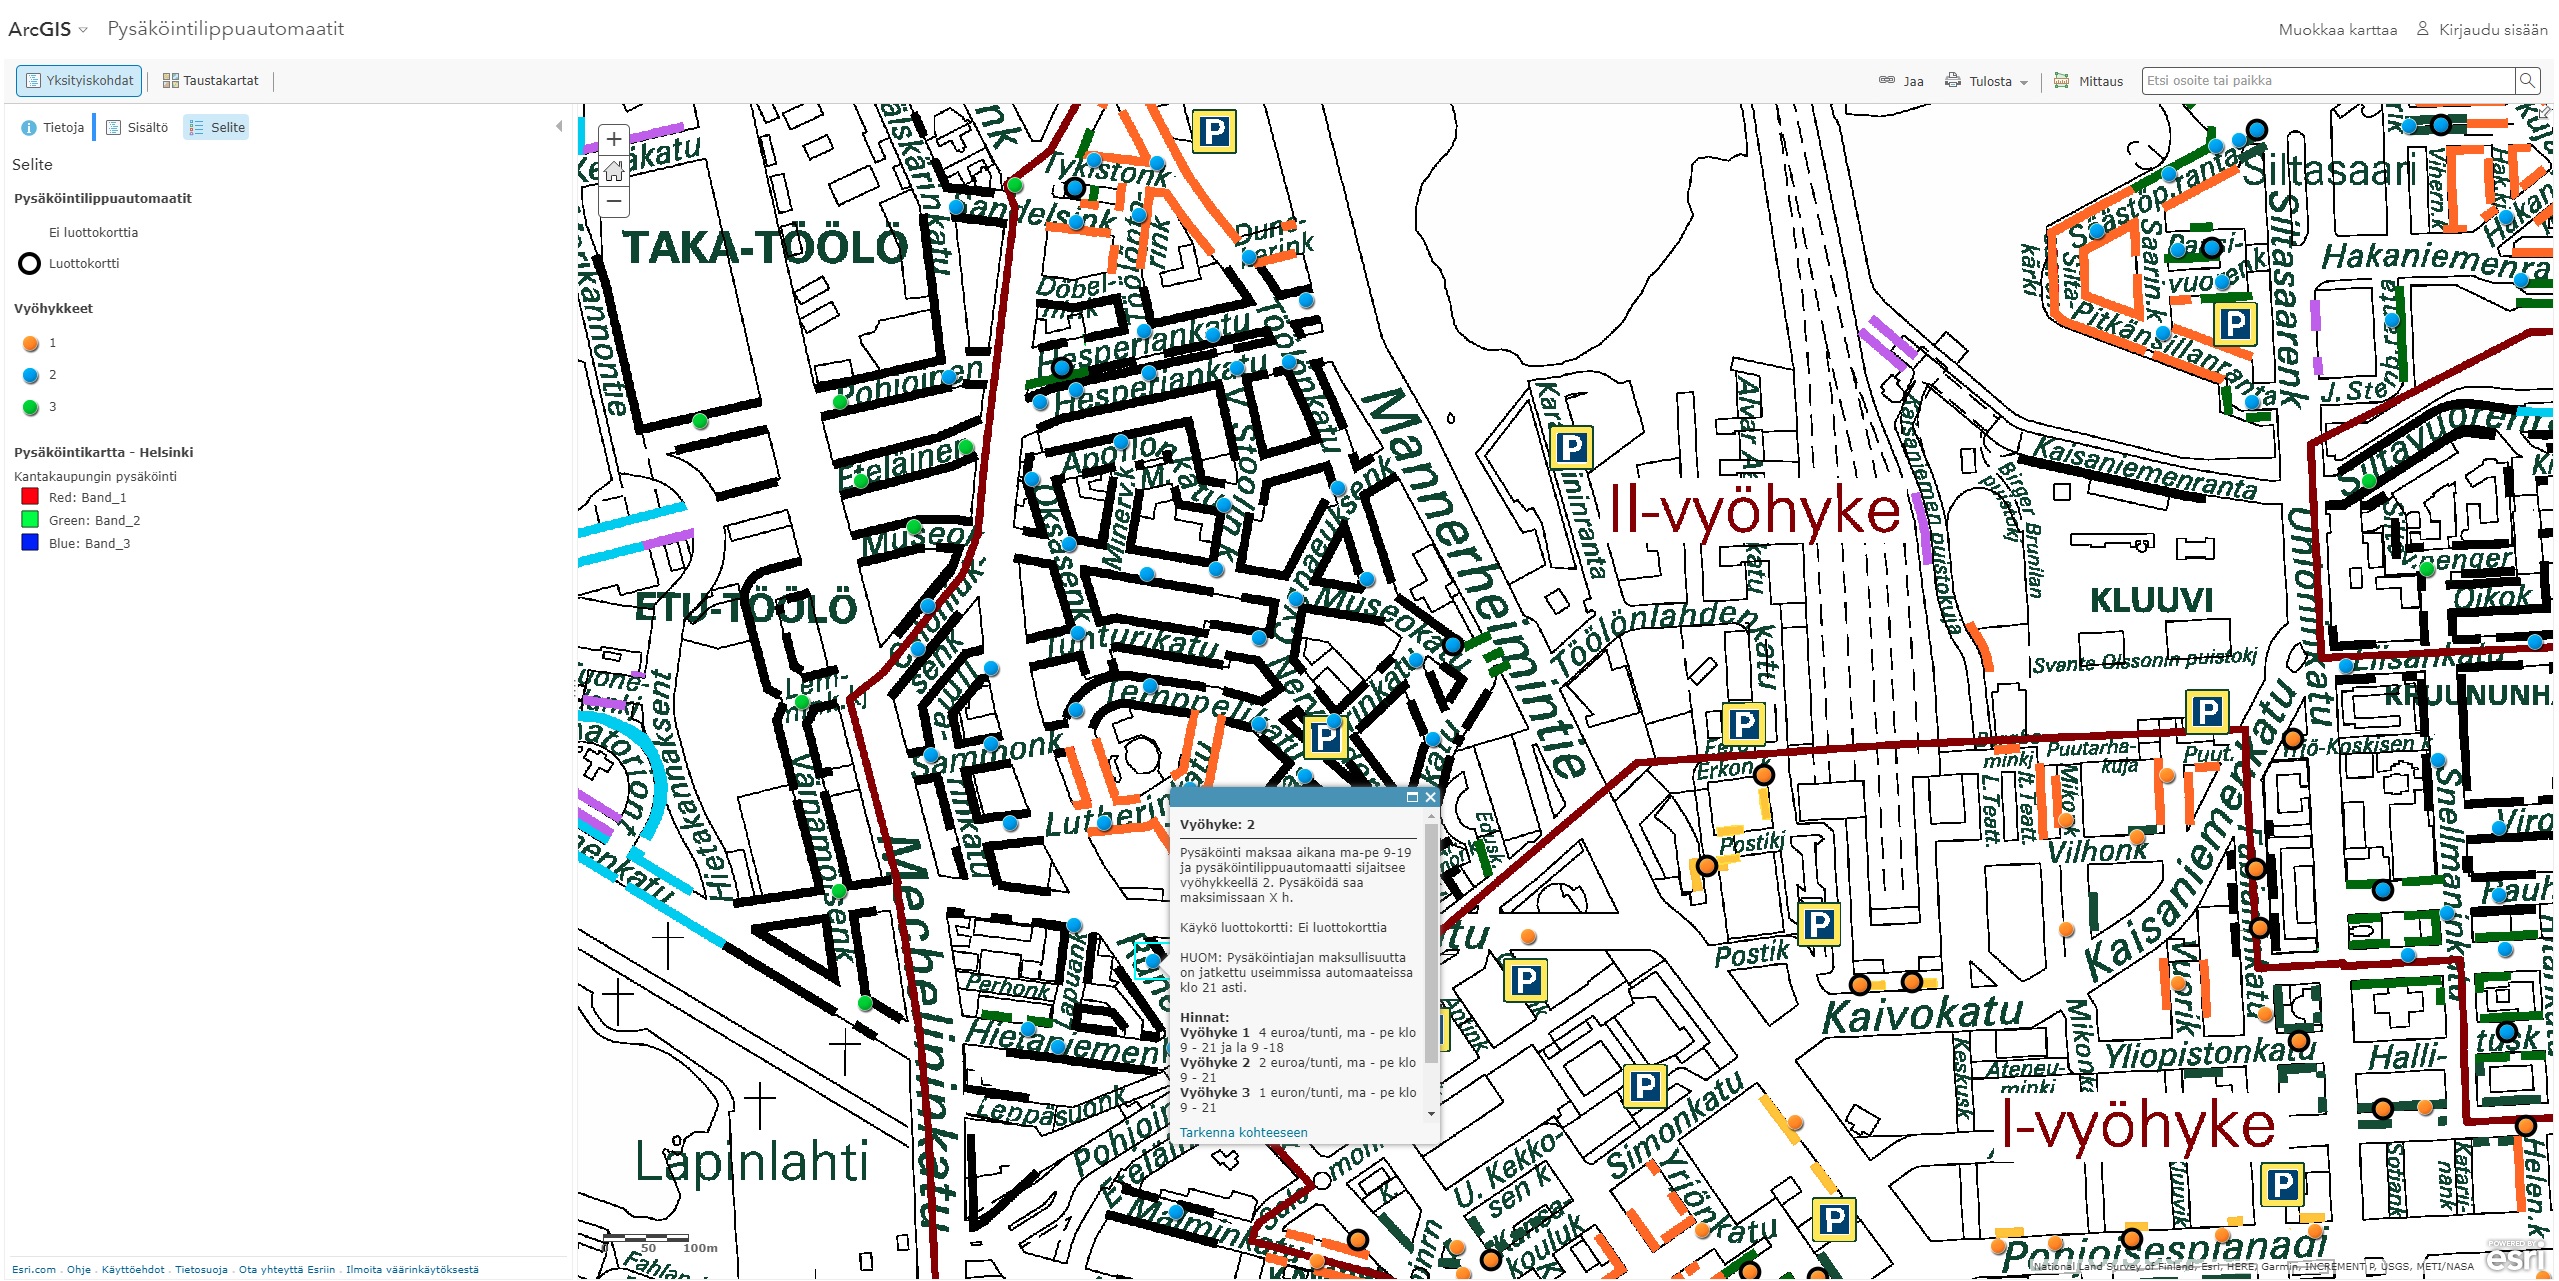
Helsingin pysäköintilippuautomaatit
29.11.2017 -
Liikenneonnettomuuksien tiheys lämpökarttana
29.11.2017 -
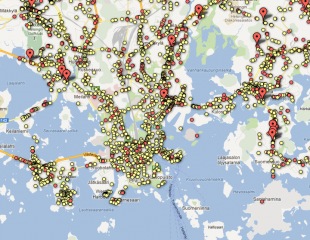
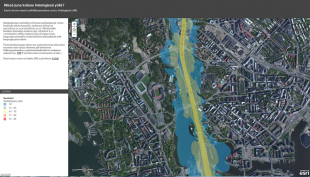
Missä Helsingissä rysähtää?
29.11.2017