-
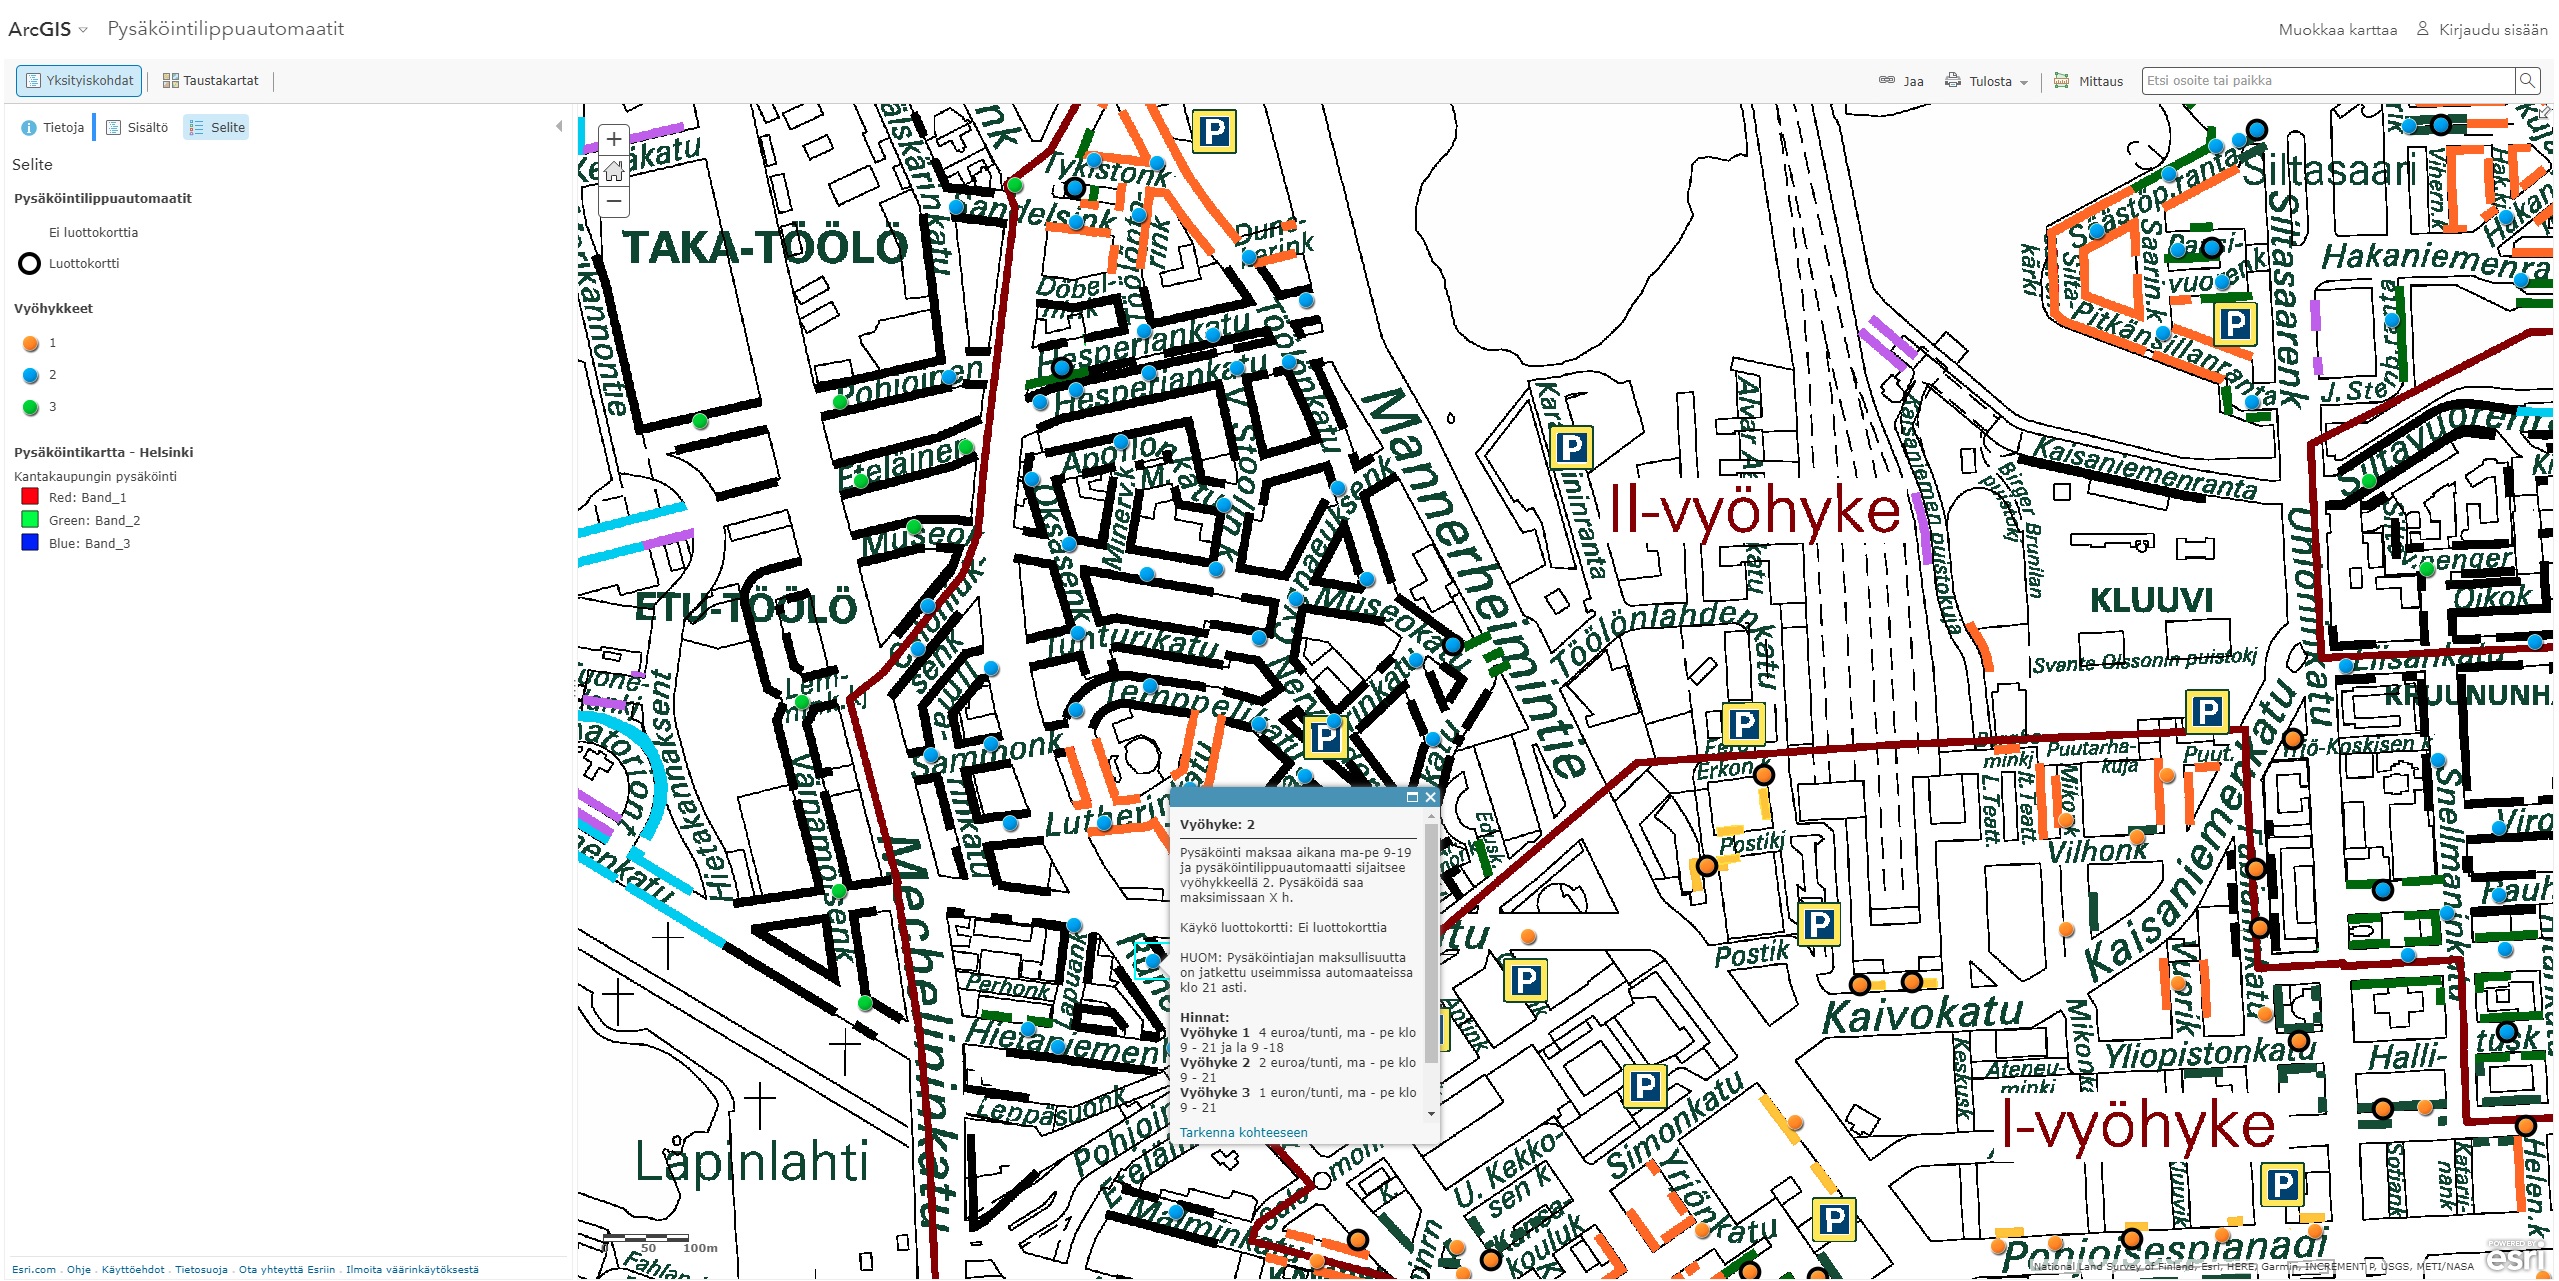
Helsingin pysäköintilippuautomaatit
29.11.2017 -
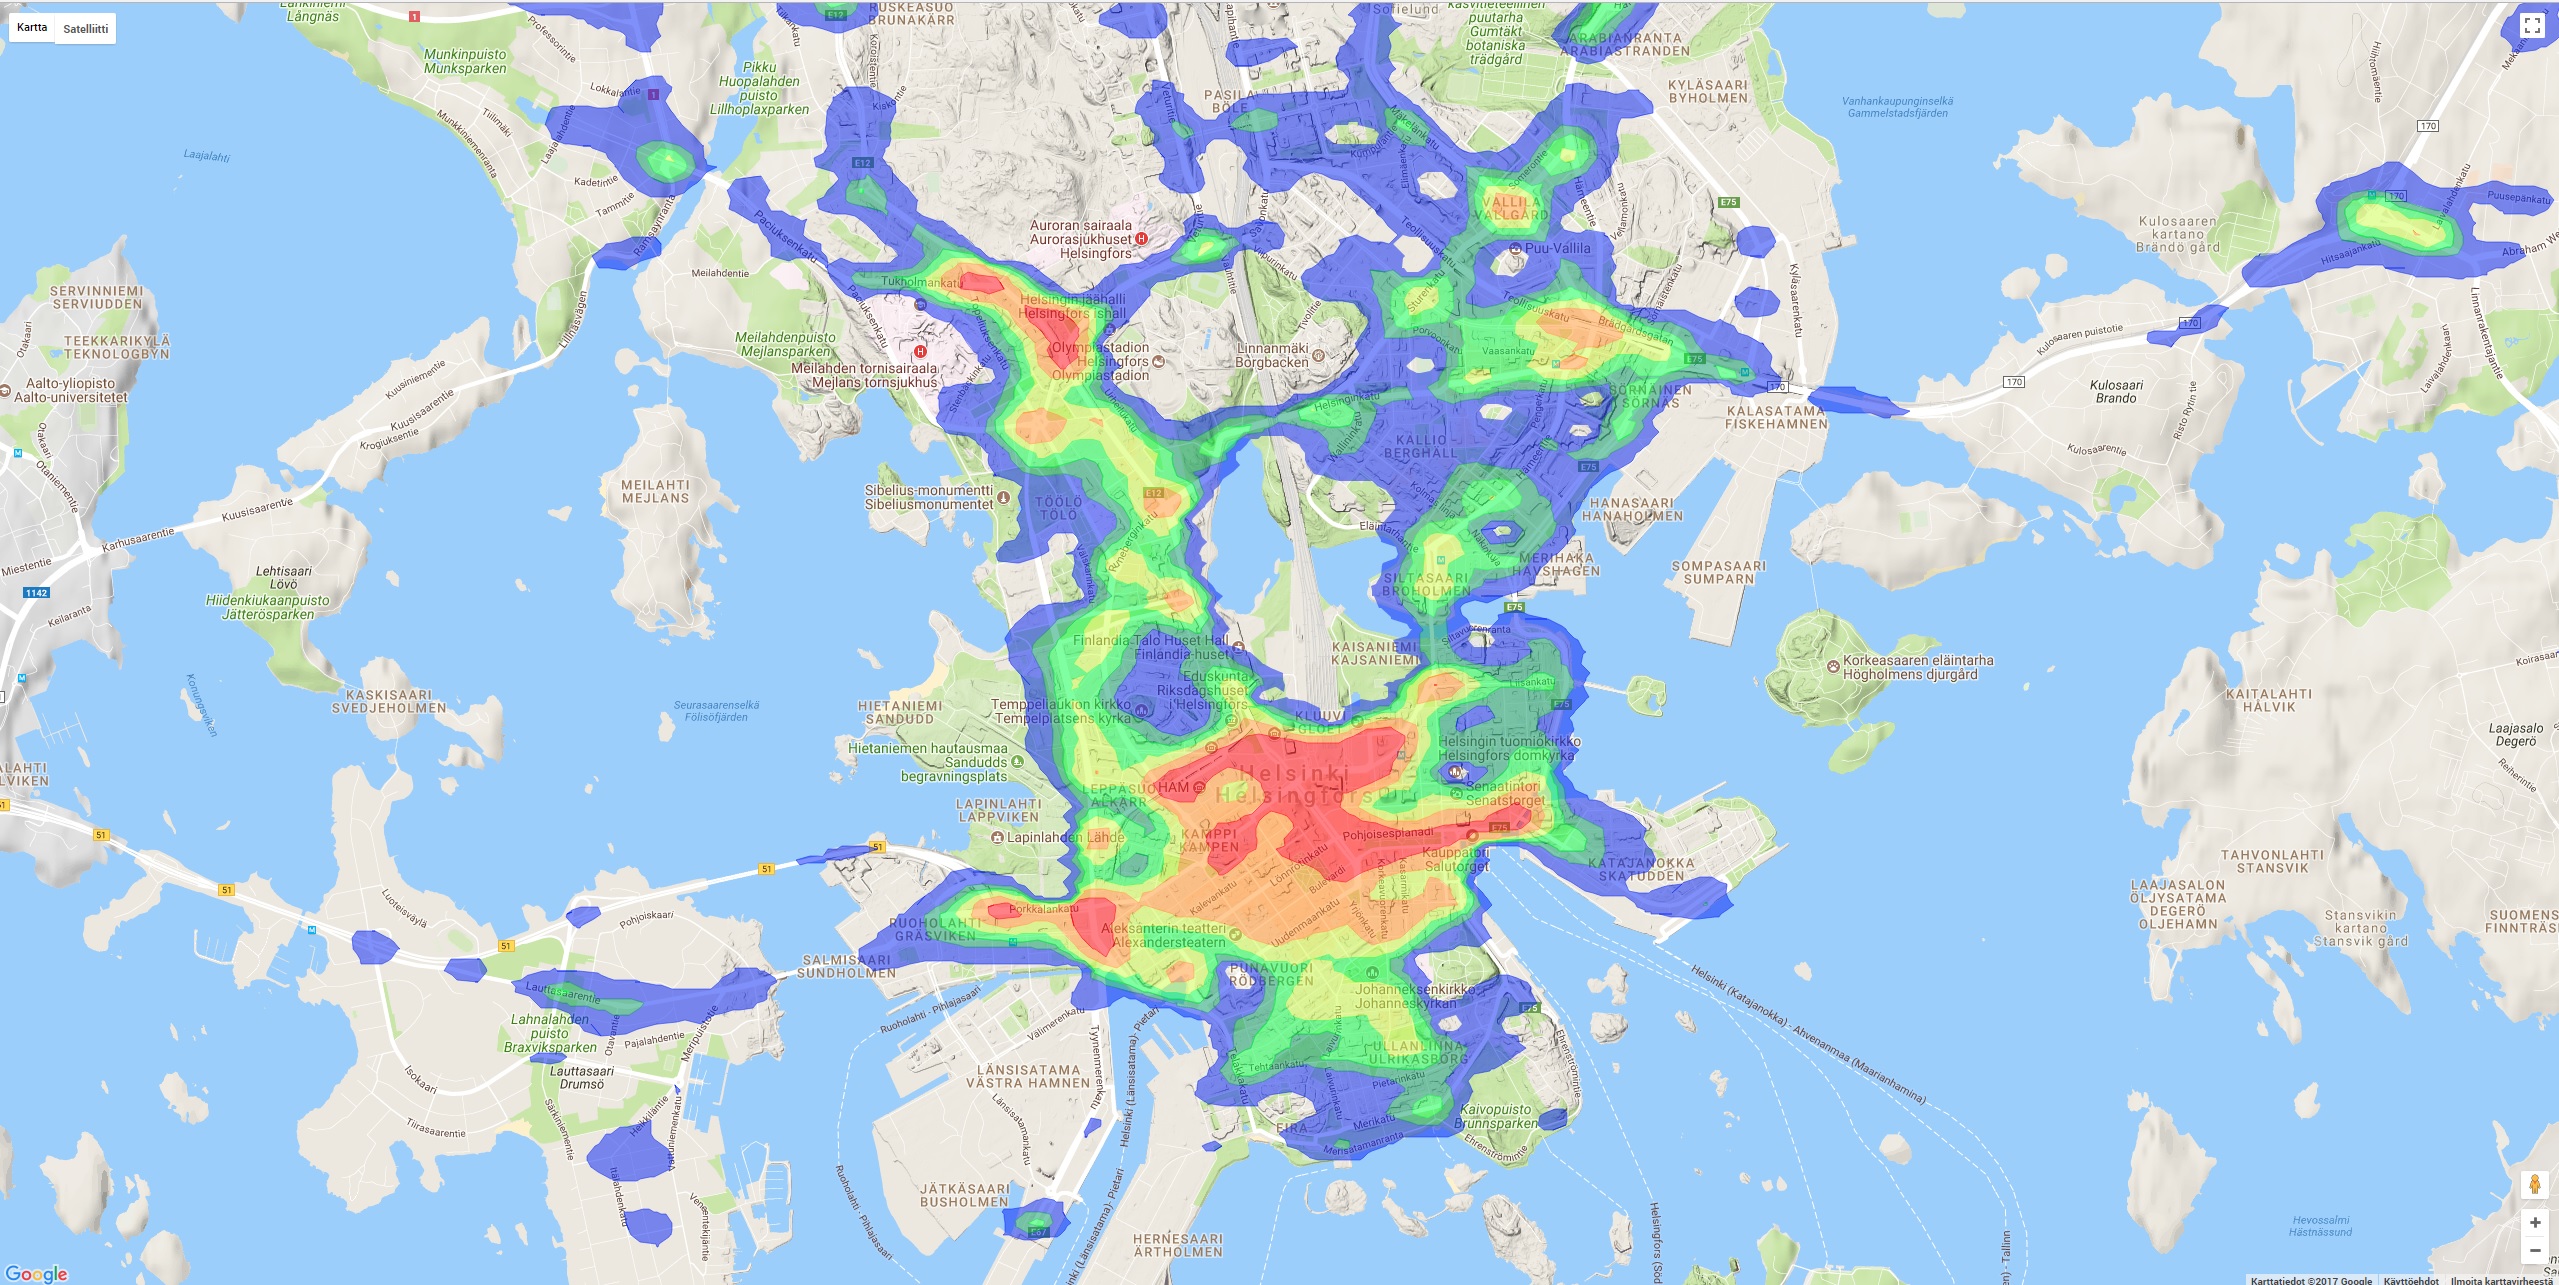
Liikenneonnettomuuksien tiheys lämpökarttana
29.11.2017 -
Missä Helsingissä rysähtää?
29.11.2017 -
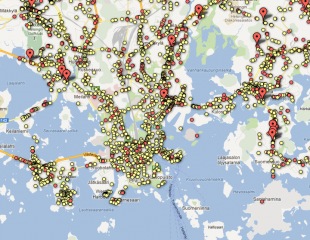
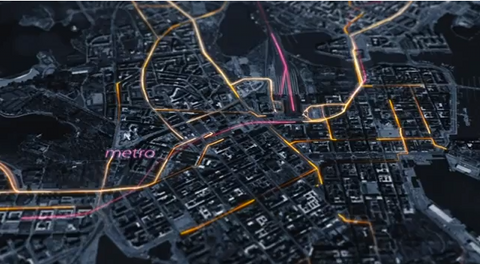
MenoMap
29.11.2017 -
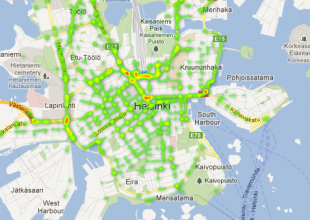
Liikennemäärien visualisointi
29.11.2017 -
semantic.hri.fi-esimerkkisovelluksia
28.11.2017 -
Helsingin vaarallisimmat risteykset
28.11.2017 -
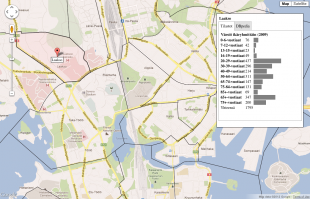
Presidentinvaalitulokset pääkaupunkiseudulla
28.11.2017 -
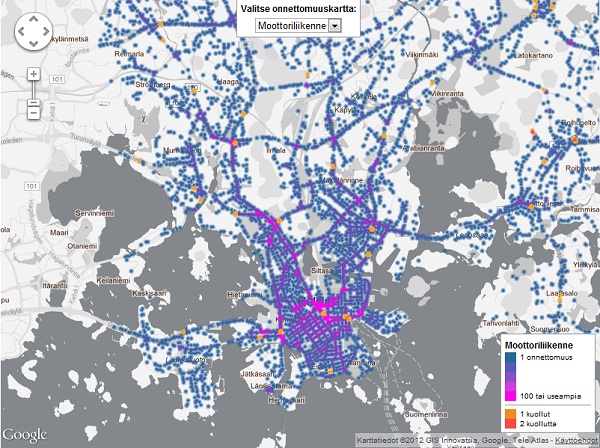
Helsingin liikenneonnettomuudet
28.11.2017 -
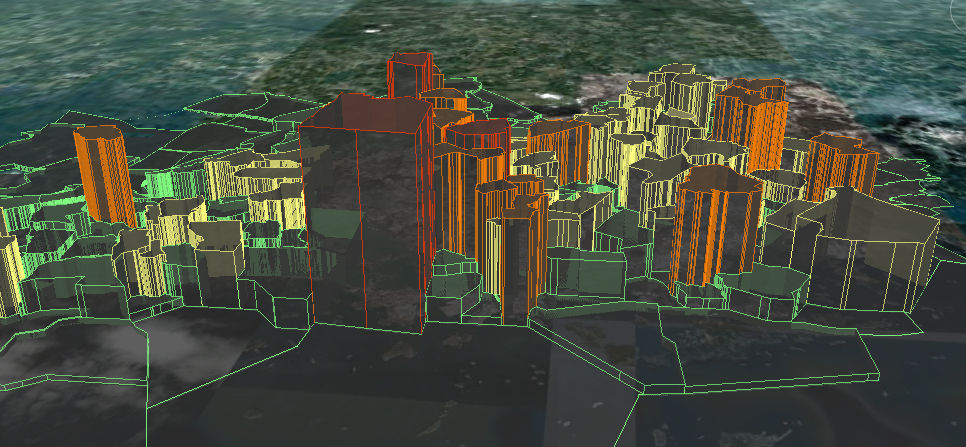
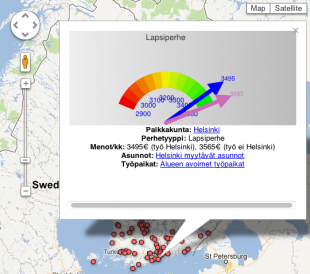
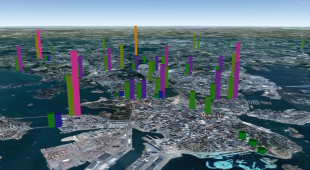
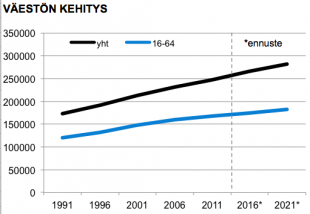
Pääkaupunkiseudun 4D-väestökehitys
28.11.2017 -
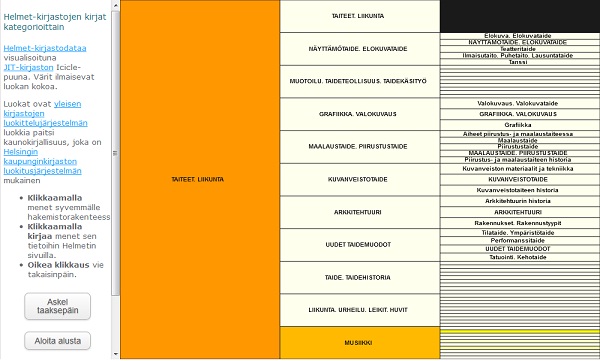
HelMet-kategoriahaku
28.11.2017 -
busbus
28.11.2017 -
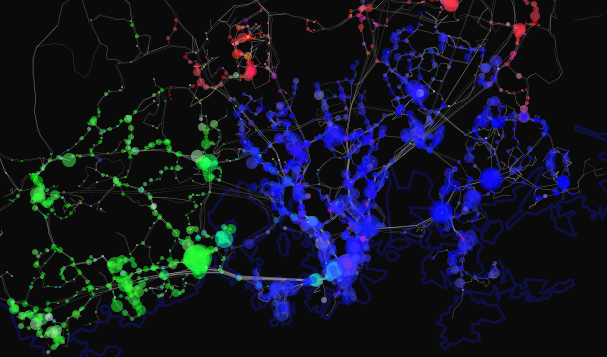
Helsinki Public Transport Visualized
28.11.2017 -

Interaktiiviset visualisoinnit kaupunkidatalla
28.11.2017 -
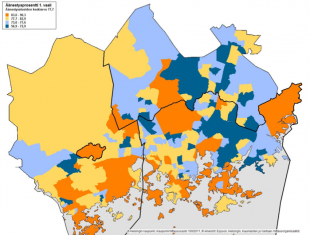
Espoo alueittain 2011 profiilisivut
28.11.2017 -

Tax Tree
24.11.2017