Interaktiiviset visualisoinnit kaupunkidatalla (Archived)

FloApps Oy - Published 28.11.2017 - updated 27.6.2022

  1. 2017-11-28-090010.582490Interaktiiviset-visualisoinnit-kaupunkidatalla-pieni.png

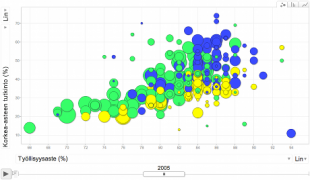
With the visualization, it is possible to examine Helsinki Metropolitan area data on a map with the help of Google Motion chart. The user can choose which areas and phenomenon to examine.

The maintenance of the visualization ended in 2013.

Used datasets