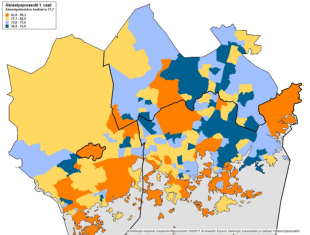

A quick MapInfo-map PDF analysis of the results of the second round of the Presidential Elections in the Helsinki Metropolitan area.
This visualization was a test of combining Helsingin Sanoma's voting results data with HRI's open data. This is an example of the type of analysis one is able to do with these data sources.