Sporametri: Urban air quality monitoring with moving sensors
In 2020, Forum Virium Helsinki published data concerning air quality measurements collected using devices installed on trams. The data was collected during mySMARTLife-project.
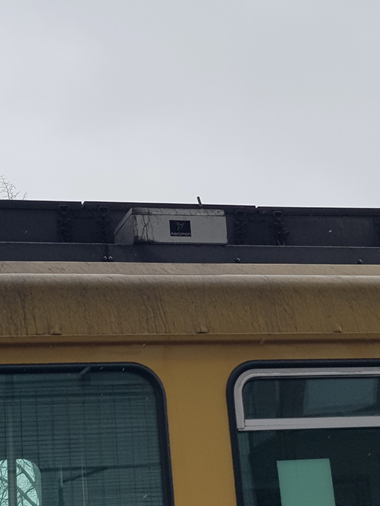
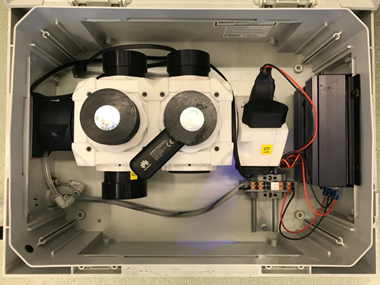
As part of the mySMARTLife -project, new and innovative methods for air quality monitoring were developed. A common limitation with air quality monitoring is that the observations cover only a very limited space. In order to better understand the air quality as a city level phenomenon, the observed space needs to be expanded without increasing the cost of sensor equipment. In the case of City of Helsinki, the tram network provides a suitable platform for observations because of the low emissions and standard routes. The measurement pilot was made together with a Finnish emission measurement specialist Aeromon Oy. Their Director of R&D Matti Irjala has provided the following description of the pilot project.
About air quality monitoring
Air quality (AQ) monitoring has been done with fixed analyzer systems for decades now. Whereas these technologies thrive in accuracy and reliability, they are often very expensive and cumbersome (typical size is similar to an old-fashioned home computer with weight of > 10 kg and price > 10 k€). This makes them a poor tool for agile, broad and dispersed AQ monitoring. It has been common to establish a sparse network of fixed AQ monitoring stations equipped with a rack of analyzers in cities and large industrial sites. Thereafter the lack of data from between these sparsely located stations have been filled with different kinds of air quality modelling. Without doubt, the data produced by these stations can be of extremely high quality and the connected computer models may work well in large scale and averaged over a period of several months. Unfortunately, this solution fails to produce hyper-local AQ information today between your residential building front door and nearest tram stop, inside the tram, at school yards and busy street corners. To meet this need, research community and companies have recently turned their interest towards sensor technology. Just like analyzers, the sensors come in many sizes and shapes and there are a huge number of working principles from which to pick one. In contrast to the conventional technology, sensors are extremely low-cost (in range of 1-100 €), small (from pinhead to smart phone size), and easy to deploy not only in fixed installations but, moreover, onboard public transportation, bicycles, drones of even as wearables such as smart devices and clothing. So, is the problem solved now? Well, yes and no. These attractive features of sensors come with a price.
Sensors and interference
Whereas the conventional analyzers provide highly reliable data on the pollutant it is designed to measure, sensors tend to react on multitude of different factors. To be honest, the analyzers would most probably do the same if they were to be dragged around city streets exposing them to vibration and changing ambient conditions (one major factor of their data quality is that they are kept in a protected and stable environment 24/7 around the year). However, sensors are made to be exposed to the real world. From this environment we must try to extract all factors effecting the data quality. These factors are called typically cross effects or interference. For a long time, these cross effects and the general performance of sensors limited their use into very specific and typically industrial applications, such as single gas alarms and such. However, as the interest towards the potential of sensor technology has increased, so have the knowledge and tools to expand their applicability into e.g., AQ monitoring.
So, what kind of cross effects might affect the sensors? The following list is not complete, but it gives you an idea on what we are up against. Sensors react to the concentration of the target pollutant, but they also react to other gases. Which gases and how many of them depends on the specific sensor model. They might react to changes in temperature, humidity and pressure, moreover the sensors’ response to the target pollutant concentration might depend on these ambient parameters. And let us not forget vibration. Moving forward, we have a wide spectrum of different kinds of electromagnetic interference (EMI), also called as radiofrequency (RF) interference, which can originate from almost anywhere in this era of wireless communication. Then the sensors get old which changes their response to majority of the beforementioned factors. This is called the aging effect. Moreover, going into details we can find a multitude of new potential issues if we look closely to the electronics the sensor is connected to or the entire signal path from the sensor’s output to our data processing instance, but I will leave these factors out from this text and focus on the interferences listed above.
So far, we have i) primary parameter (e.g. concentration) we are trying to measure, ii) other interfering compounds like gases or particles, iii) ambient conditions, iv) mechanical factors, v) RF interference and vi) intrinsic factors affecting the output of a single sensor. How to come up with a somewhat reliable reading of a single gas concentration after all this?
Solution requires understanding
The answer is by design, procedures, and data processing. For instance, in order to understand all the gaseous compounds reacting with our sensor and the role of ambient conditions in all this we must investigate and study the sensor manufacturers’ documentation on this topic and perform a multitude of experimental tests of our own in various different conditions with different setups to come up the actual full set of several sensors (all including their own track of individual interferences) needed to gather the data needed to calculate that single concentration reading. By calculation, I mean the use of a set of intelligent algorithms derived from the manufacturer documentation and experimental tests we have performed earlier. In relation to these algorithms and the aging effect or even possible unwanted contamination of the sensors we can perform regular quality assurance checks, such as sensor calibration with calibration gases or by exposing the sensors to known conditions to fine down the performance of the data processing algorithms. An example of a known condition is a fixed AQ monitoring site with a rack of analyzers. Of course, we must remember the importance of a proper mechanical design to reduce the effect of impacts, vibration and wear and tear of materials to the sensor response. In a way we are doing our best here to stabilize the sensor’s conditions, so that our algorithms can produce reasonable data. The same goes with RF shielding, which is a part of mechanical and electronic design, and the only way to protect sensors from RF interference in their normal working environment.
Final words
After all abovementioned is done, one crucial question remains. How to build a compromise between design, procedures and data processing which enables reliable, easy to use and low cost AQ monitoring? I believe that it is important to emphasize the design and procedures, as relying solely on the data processing increases the risk of losing valuable information while processing. Another important factor is the selection of the right components into the application at hand. There is an increasing number of sensor manufactures available globally and their sensor selection is growing every year. Picking the correct component may be game changing considering the queueing nature of cross effect tackling.
Sensor technology offers a very flexible and versatile measuring method for AQ monitoring which can enable hyper-local AQ data provision and, thus, filling the gaps in geospatial accuracy and modelling with conventional methods. However, one needs to consider the factors in play with sensors and keep them in mind while building the measurement setups and interpreting the data.

PhD
Director of R&D
Aeromon Oy
www.aeromon.io
Leave a Reply