R language is the data analyst’s choice
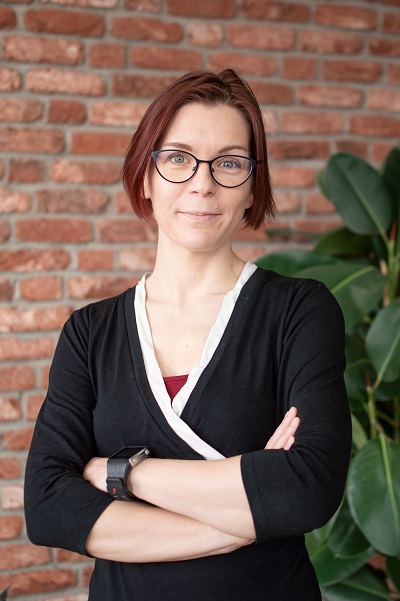
IoT Data Analyst Seija Sirkiä used her favourite tool to study how a politician benefits from his or her name.

Seija Sirkiä is living her dream job as a Senior Data Scientist at analytics company Houston Analytics. Statistics is a beautiful combination of mathematics and social sciences, and you get to do some programming, too. “And these are the tools, when you get to solve real life problems”, touts Seija Sirkiä.
The data analyst’s basic tool throughout the career has been the R language, which can be used in all stages of the data analysis, from cleaning the data to making visualisations. Sirkiä first encountered the R language as a novice statistics student in 1999, during the statistical programming course at the University of Jyväskylä. “The version was 0.64. The most progressive professors had started using R in addition to MATLAB.”
In 20 years, R, which was developed for statistical computing and graphics, has become really familiar. Sirkiä holds a Doctorate in Statistics and she has taught numerous R language courses. In her previous job at the IT Center for Science CSC, Sirkiä’s scope of responsibilities comprised maintaining the R environment on the CSC supercluster.
In her new job, R language is used for solving problems on the corporate side. Having left the academic world for Houston Analytics half a year ago, Sirkiä has already written R code for projects in many fields, from HR planning to the processing of IoT data. “I have primarily focused on industrial IoT projects: big machines produce sensor data, which is then utilised.”
One of Houston’s industrial clients is paper machinery manufacturer Valmet. By putting the data flow produced by thousands of paper machine sensors under constant monitoring, it is possible to reduce the stoppages of the expensive machines and extend their maintenance intervals. “In predictive maintenance, the result of our data analysis can be, for example, a prediction diagram, which shows when we expect that some wearing part is due for a replacement”, describes Sirkiä.
Command prompt scares the R novice
Having taught dozens of R courses, Sirkiä says that the biggest confusion among the course participants has been caused by R’s simplified user interface. The new user is greeted by a sole command prompt. Many course participants were university researchers, who were used to analyse their research data, for example, through the user-oriented menus of statistics software SPSS. “R will not do anything for you automatically”, laughs Sirkiä.
The strengths start to reveal themselves when the first shock has passed. The first asset is the price. The free software licence attracts universities, who are fed up with the licence fees. Many researchers ended up on the R course having faced the limits of SPSS. “R is a real programming language and programming environment. You can do anything with it, it is also usable in non-standard situations.” For example, preparation of data is a strength of R. “It can be used to freely edit data, which is practically never in a prepared format.”

In the programming languages section, R competes with Python, which many professionals use for the preparation of data. “They are close to each other in terms of their coding philosophy. R is more fluent for this statistical stuff, it includes many options, which have to be brought into Python in some special library.”
On the other hand, Sirkiä has seen the limits of the R language in present-day IoT applications. “Producing production-ready code is easier with Python.”
Aaltonen wins elections
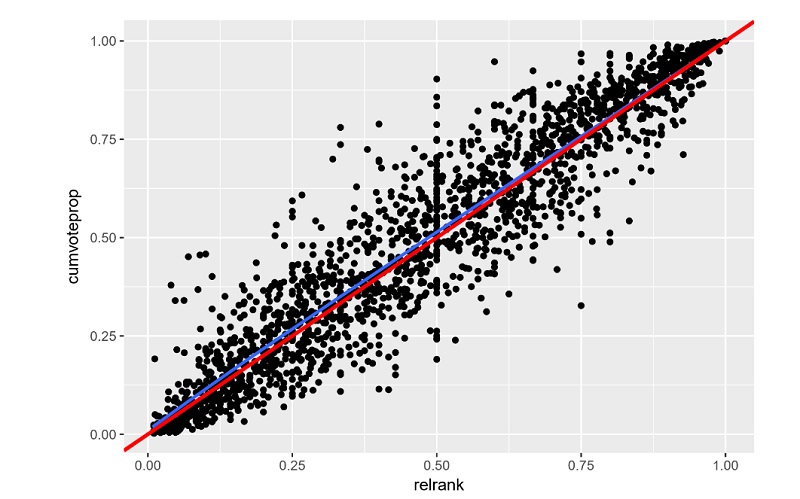
On Seija Sirkiä’s Github site, there is an elections analysis that Sirkiä calls “a hobby effort”. Its creation was inspired by a Helsingin Sanomat article about the 2017 municipal election results. A column on the editorial page discussed the difficult part of the municipal council hopefuls. After a strenuous election campaign, “some Aaltonen” is elected for the council. The journalist had sorted the 33,000 municipal election candidates in alphabetic order – and noticed that those at the beginning of the alphabet received more votes. “As a statistician, I was interested in whether the perceived difference was big or small”.

There is no standard test for analysing this, but Sirkiä had learned a method for a similar problem when working on her doctoral thesis. Now, a couple of years later, the code of her own hobby analysis looks clumsy, but the conclusion is the same. “The phenomenon exists. It is not just a coincidence that those at the beginning of the alphabet receive more votes.
Who?
Seija Sirkiä b. 1979
Education Doctor of Philosophy (Ph.D), Statistics
Job Houston Analytics, Senior Data Scientist
Favourite open data tools
- R language
- Git version control
- Flowdock
What she has done with open data
Analysis of how the first letter of the candidate’s last name affects the election result.
What data she would find interesting
“Nothing in particular, there is so much data available nowadays. Creatively combining data sets is the thing.”
Mac, Windows or Linux
“This laptop has Windows, I use whatever I’m given.”
Greetings to HRI
“Keep up the good work.”
LinkedIn profile
The most probable explanation for this is the Wikipedia-recognised anchoring effect. The phenomenon is a cognitive bias, where an individual favours an initial piece of information offered.
How big of an absolute advantage those at the beginning of the alphabet got is hard to define, but the statistician has a hint for wannabe politicians. “If you can choose, pick a name at the beginning of the alphabet.”
Group tools in use
Nowadays, making data analyses is group work. Therefore, it is no wonder that the instant messaging apps make the analyst’s list of favourite tools. Flowdock, which Houston uses, or Slack are convenient ways of messaging within the team. Another Sirkiä favourite is version control system Git. “Previously, I thought that it was solely for software developers.”
When she got to know it better, Sirkiä discovered that Git is suitable for programming code, but also for producing almost any sort of text as group work. It can be used for sharing course material to students or writing research articles together.
The HRI web service is full of data concerning the Helsinki Metropolitan Region. What data that has been opened through HRI excites the professional?
Sirkiä’s absolute favourites is the data connected to traffic and city infrastructure. For example, Sirkiä has utilised traffic volume data on her R courses. Now Sirkiä is thinking about an application idea, which would use the real stop data for HSL’s trams and buses.
“Buses have timetables and, by means of live data, it is possible to check where the bus really is now. Using past observations, it would then be possible to create a real timetable for the stop, which is based on historical information and tells how likely it is that the bus is on time or how much it is likely to be late”, ponders Seija Sirkiä.
Translation: Henrik Andersson

Leave a Reply