Date
Categories
Author
-
Hami Kekkonen
Helsinki region GIS data freely at your disposal!
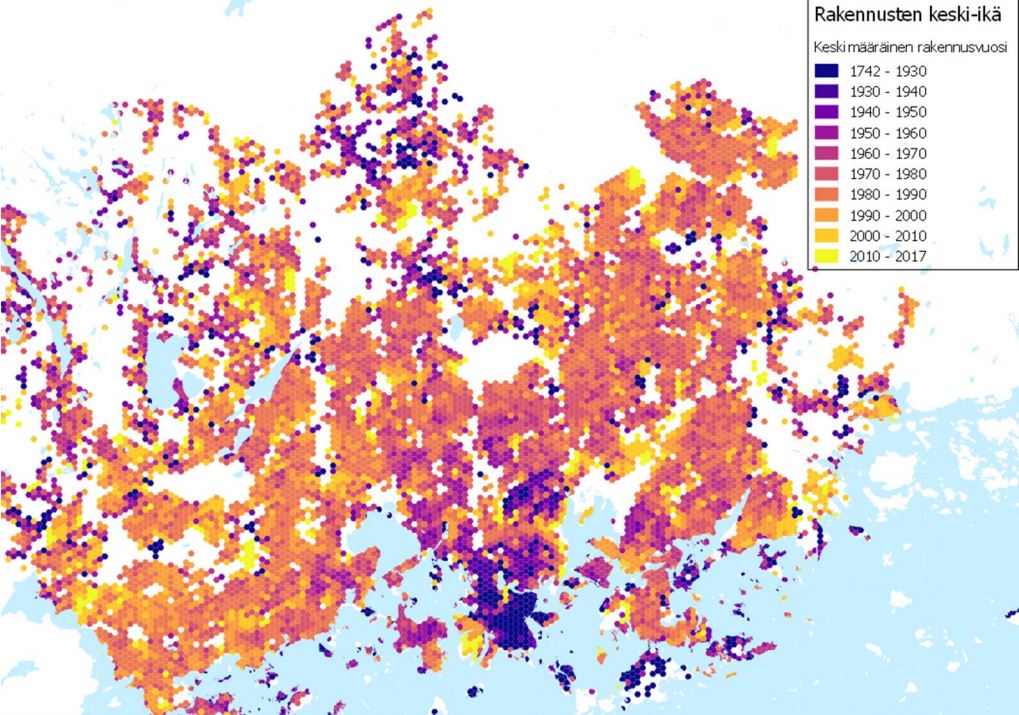
Guide map, building data, traffic lanes, noise zones, subgrade data sets, population information grid, school admission areas and much more! Did you know that these and dozens of other GIS data sets from the Helsinki region are available as open data, freely at your disposal? The opening has given us all an opportunity to utilise these valuable data sets freely for our own purposes – there are plenty of examples where they have been used.
The Helsinki Loves Developers developer meeting in May offered an extensive view into the open GIS data sets of the Helsinki region. In HRI, the GIS data sets have always been among the most downloaded and also the most requested data sets. GIS experts Ville Jussila from Helsinki, Mirja Metsälä from Espoo and Arsi Juote from Vantaa have noticed the increase in the number of visitors to their services.
A lot of GIS data sets have already been opened
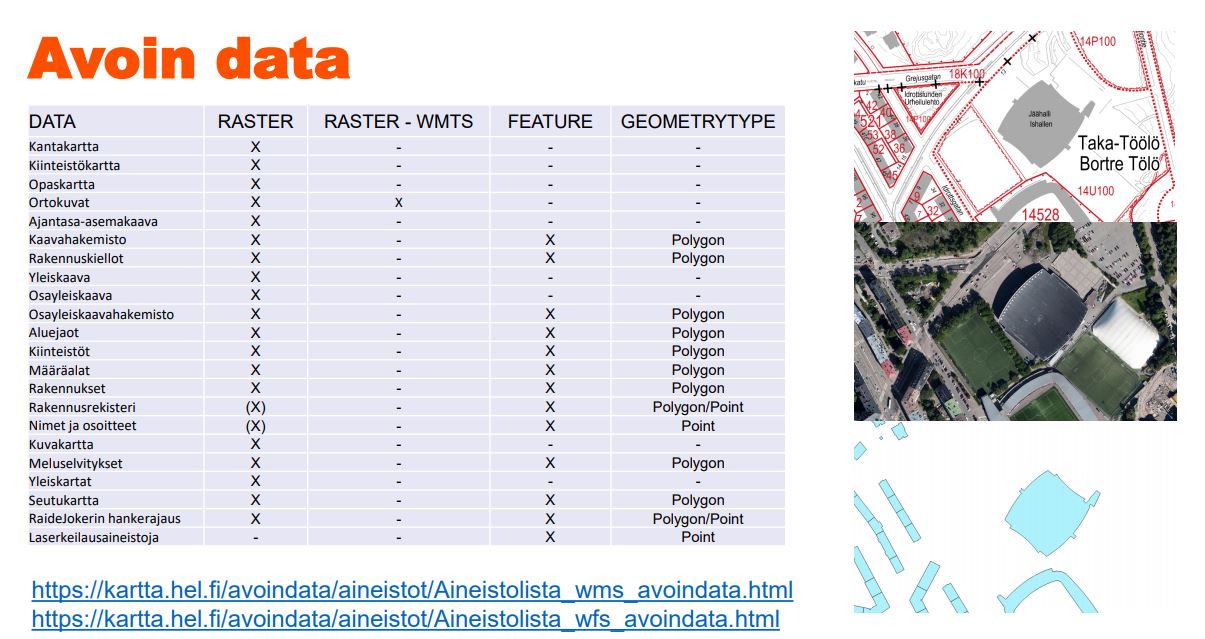
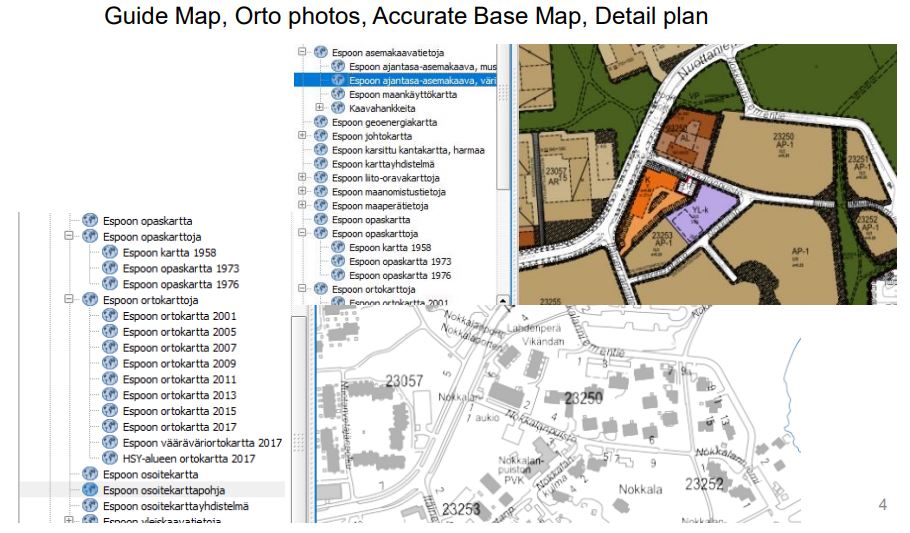
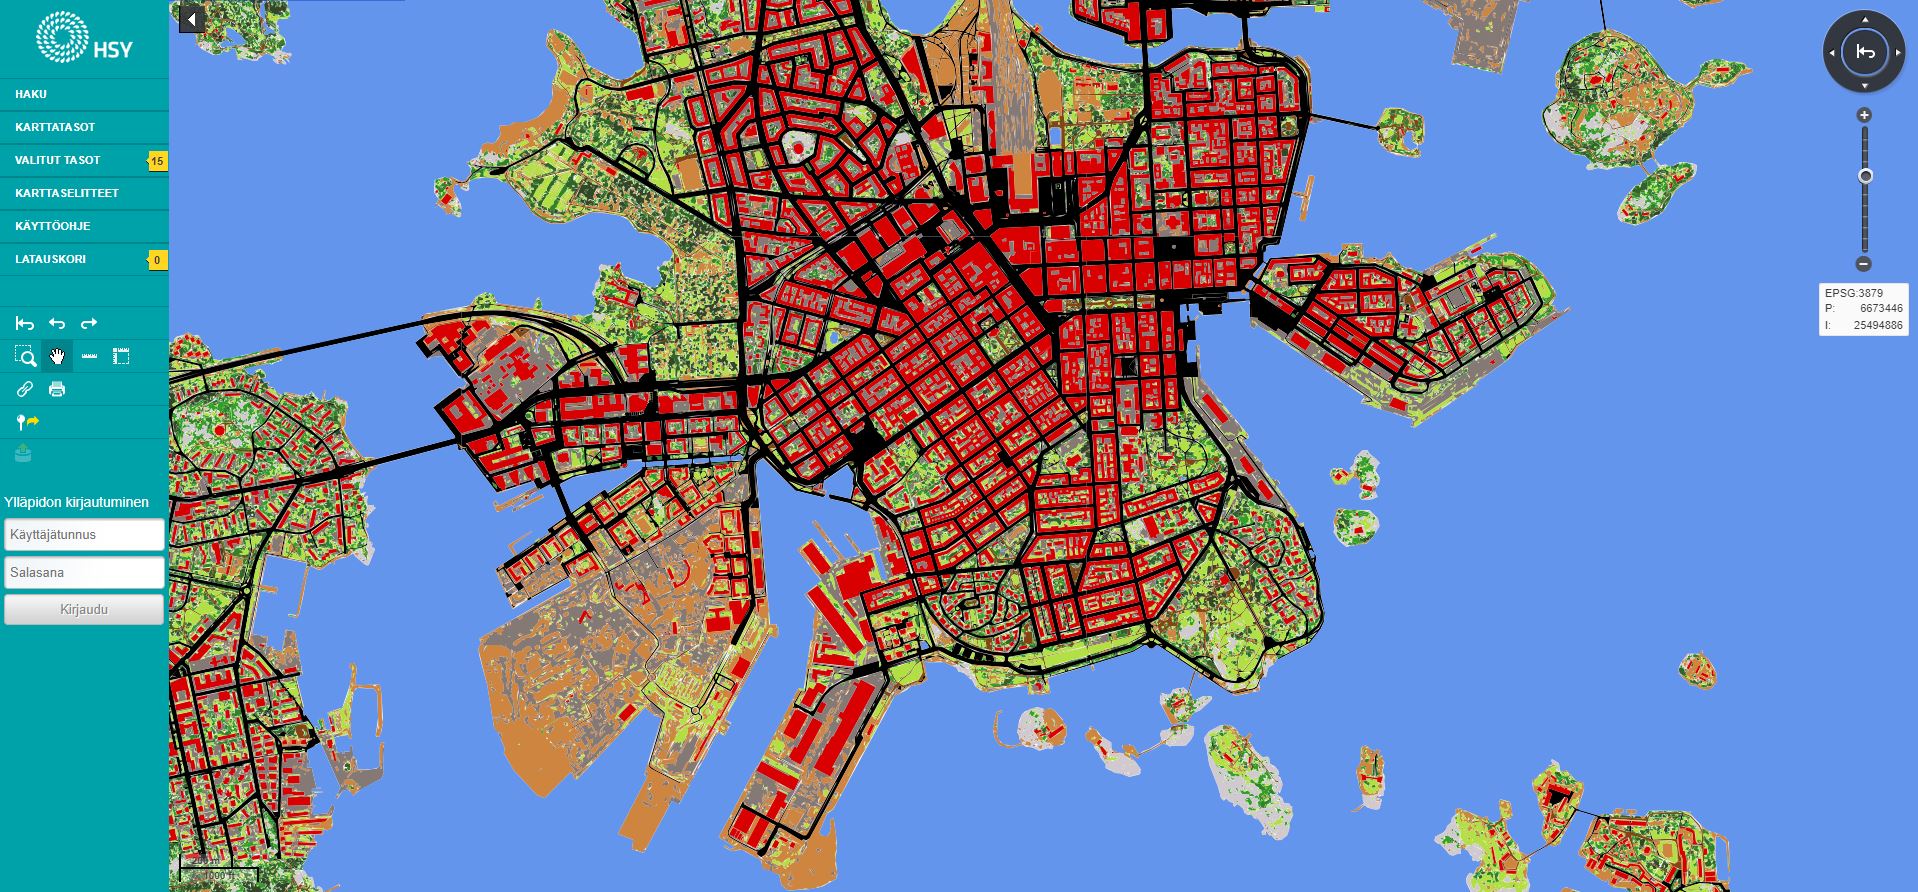
There are numerous GIS data sets available of the Helsinki region. The city survey organisations in Helsinki, Espoo and Vantaa have opened their GIS data mainly through their own WMS and WFS interfaces, but also as file distribution. The Helsinki Region Environmental Services Authority HSY and Helsinki Region Transport HSL have also opened GIS data sets covering the entire Helsinki region.
The addresses to the WMS and WFS interfaces of the cities have been compiled in the enclosed table. All open GIS data sets of the Helsinki region including metadata and interface links are also available in HRI’s data catalogue.
| WMS | WFS | Open data website | Map service | |
| Helsinki | kartta.hel.fi/ws/geoserver/avoindata/wms | kartta.hel.fi/ws/geoserver/avoindata/wfs | kartta.hel.fi/avoindata | kartta.hel.fi |
| Espoo | kartat.espoo.fi/teklaogcweb/wms.ashx | kartat.espoo.fi/teklaogcweb/wfs.ashx | kartat.espoo.fi/avoindata | kartat.espoo.fi |
| Vantaa | gis.vantaa.fi/geoserver/wfs | gis.vantaa.fi/geoserver/wms | gis.vantaa.fi/rajapinnat | kartta.vantaa.fi |
| HSY | kartta.hsy.fi/geoserver/wms | kartta.hsy.fi/geoserver/wfs | hsy.fi/avoindata | kartta.hsy.fi |
| HSL | in planning phase | in planning phase | www.hsl.fi/avoindata | data-hslhrt.opendata.arcgis.com |
Besides the WMS and WFS interfaces, the open GIS data sets of the cities can be obtained as files either through HRI’s or the city’s own website for open GIS data. The data sets can easily be previewed in the cities’ map services. Many data sets can also be downloaded through the map service.
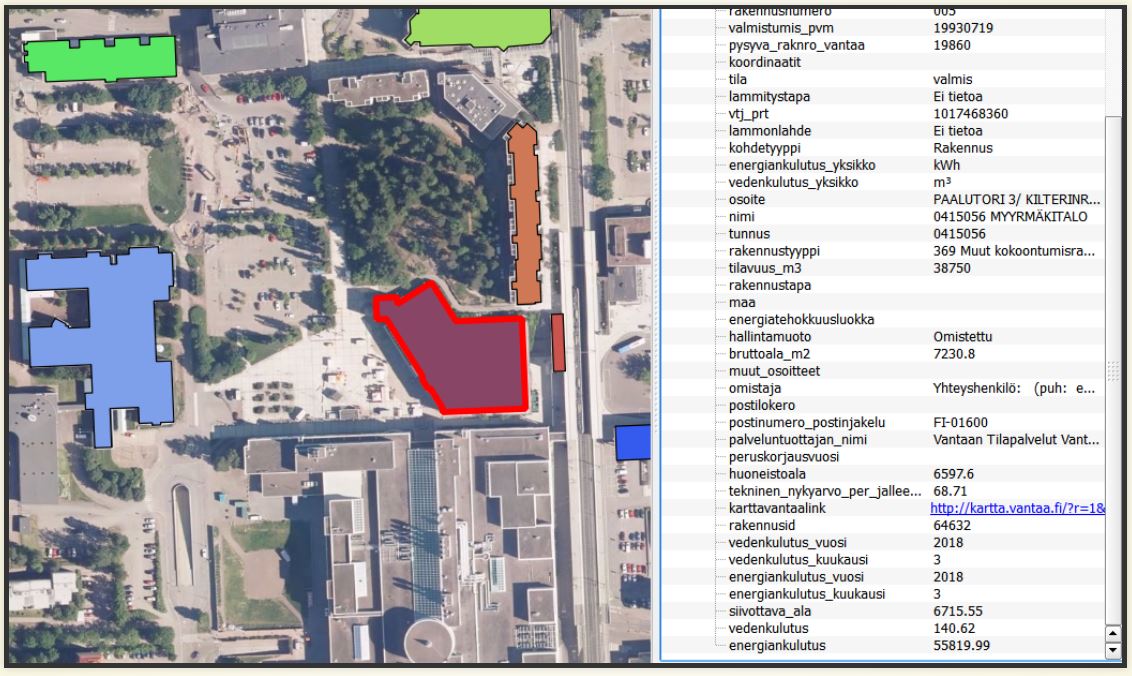
One of the most popular GIS data sets is the register of the local offices in the entire Helsinki region and the service map that has been built on top of it. Through the service map’s REST interface, the user can search for information about anything from day-care centres and parks to rug washing piers and charging spots for electric cars.
Many of the Helsinki’s integral GIS data sets are already available through the city’s WMS and WFS interfaces.
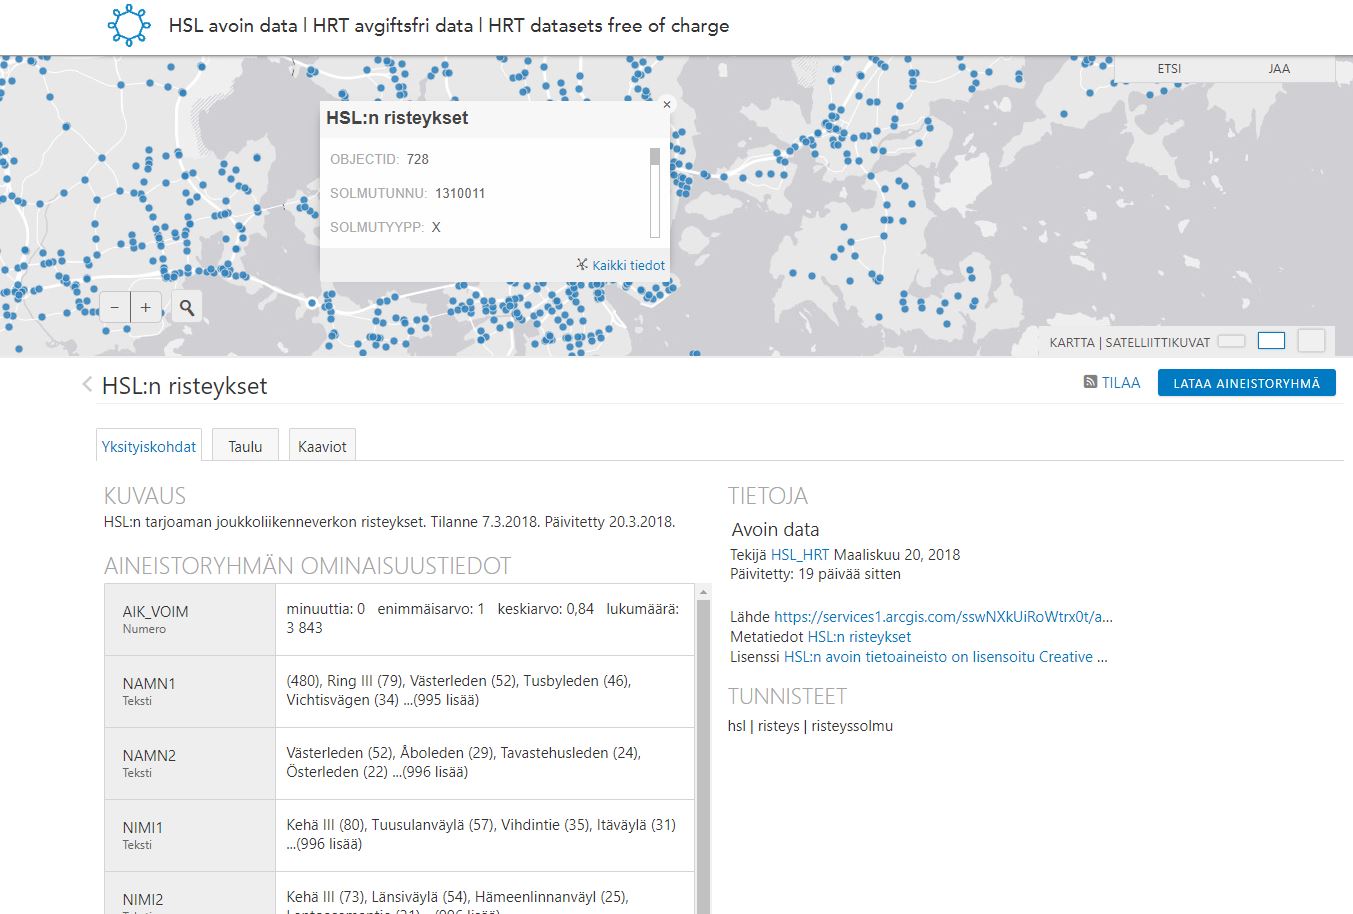
HSL has a long tradition of opening data. In addition to the popular Journey Planner’s interface HSL offers information relating to public transport for instance in its ArcGis, park-and-ride and Louhin services-palveluissaan.
Geographic information is versatile

A large part of the application examples in the HRI’s application gallery utilises geographic information in some way. Two developers, GIS wizard Antti Ahola and famed GIS visualisation twitterer Topi Tjukanov, presented their works at the developer meeting.
To Antti Ahola, geographic information is both a job and a hobby. In his GIS blog Ahola presents his numerous hobby works and tells how they are made. When it comes to business, Ahola – like many other people who use open data for business purposes – does not want to tell more than that there is use for data. Ahola’s favourite tools are ArcGIS Online and QGIS, the coding is done with Python.
Topi Tjukanov is known, among other things, for his fascinating GIS visualisations that he shares on Twitter. Similar visualisations can be found on his website as well. Tjukanov has six pointers for data openers:
- A broader range of formats and ways to open data. If you open data, for example, in shape format, then you have SHP users utilising the data. A larger part of the developers prefer using, for example, JSON instead of WMS/WFS.
- Sort out the metadata and the documentation!
- The data must be up-to-date, maintained and always available.
- Think about how the users can improve or enrich your data.
- From an AI and machine learning perspective, there is a need for bigger amounts of data and bigger data sets.
- Be realistic in your expectations.
Inspired by concrete application examples, the discussion meandered to the future. How can data, and especially GIS data, be used to predict the future? Is it possible – and how hard would it be? Do suitable algorithms already exist? How could, for example, changing traffic conditions be modelled? It was concluded that it should either be based on a vast amount of high-quality data or a very simple phenomenon. For example, recursive nerve networks could be an interesting tool to be used in studying spatial time series. The computational capacity of tools and machines develop all the time; at best, the work that previously took weeks can now be done in even a day.
Wishes concerning data and a distribution channel…
Even though plenty of GIS data is already available, many data wishes were still presented during the afternoon. These ranged from the number of jobs, the number of pedestrians and cyclists and the routes driven with city bikes – obviously anonymised – to the data accumulated in Forum Virium’s IoT trial and the data concerning the activity of a turtle at Helsinki Zoo.
Some participants were hesitant about the service level agreement of the data sets – especially if the data is used for a commercial service, it must be ensured that the data is up-to-date and permanently maintained. When it comes to Helsinki, it is possible to sign a data set agreement, tells Ville Jussila. When the agreement is signed, Helsinki’s city survey gets the contact information of the data developer and can thus easily communicate changes to him or her.
Another interesting question was whether an external data developer can send an open data set that he or she has modified back to the city for distribution through the channels of the city. For example, the person who asked the question had used a point cloud to create a raster map and wanted to make it freely available. This, as well as correcting possible mistakes or complementing data sets as smoothly as possible, has been debated at HRI before, too. The cities do not yet have a channel for the distribution of data sets modified by external parties, but agreeing upon the procedures and setting up a service can be considered.
…and distribution formats
Presentation materials
Tanja Lahti: Helsinki region GIS data at your disposal!
Ville Jussila: Helsinki’s open GIS data sets
Mirja Metsälä: Espoo’s open GIS data sets
Arsi Juote: Vantaa’s open GIS data sets
Mikko Nikkanen: Helsinki Region Environmental Services Authority HSY’s open data
Markku Huotari: Helsinki Region Transport HSL’s open GIS data
Topi Tjukanov: Me + open GIS data
The cities’ GIS experts hope that the users provide feedback on both the data and its means of distribution. Distribution formats was indeed a popular topic of discussion during the afternoon. Now a majority of the cities’ GIS data is available through WMS and WFS interfaces. Is it the best way for the user? Is there a demand for other formats to complement it?
Surprisingly, WMS and WFS were unknown even to some of the GIS experts. Instead of those, the data developers asked for JSON and GeoJSON – as they are also familiar to the coders, who are not deeply acquainted with GIS data. Some of Helsinki Region Transport’s data sets have already been opened in GeoJSON format.
However, the availability and findability of data was deemed even more important than the usability of the interfaces and the different formats. The Helsinki region’s GIS interfaces have always been accessible, for which the developers gave positive feedback. Even though compiling data in different formats takes time, Topi Tjukanov still emphasises especially the findability of data.
Here at HRI, we have received a lot of feedback on how people do not know how to use the interfaces or want the data in some other format. We have reacted to this feedback by adding download links in CSV and JPEG formats to the data sets available through the WMS and WFS interfaces. Preview panes have also been added to the data sets. The work is still in progress, the aim is to have it finished by the summer. Helsinki’s city survey has prepared instructions (in Finnish) to ease the deployment of the WMS and WFS interfaces.
Translation: Henrik Andersson
see
By making building-level data and population grids publicly available, HRI is basically providing a laboratory for urban resilience studies. Have you found that the 2026 updates include more granular data on ‘green infrastructure’ or micro-climate sensors, or is it still primarily focused on traditional cadastre and transit layers?