Date
Categories
Author
-
Petja Partanen
Data tells more than gut feeling

Consultant Heidi Enho got excited about delving into open data resources when the Power BI application was released in 2015.
The visualization of Eurovision Song Contest winners throughout time, Alko’s interactive product catalog, Helsinki Region Transport’s passengers on a map, … Sulava Ltd.’s consultant Heidi Enho’s data hobby does not end with the office door closing at the end of the day. Most of her data visualizations have been done in her free time with Microsoft’s new Power BI application.
Enho’s favorite tool’s advantage is its ease of use. “If a dataset is a single CSV-file and it is in a clean format, your first Power BI -visualization will be finished within half an hour,” promises Enho.
Data analytics tools have developed immensely in the past years. Tools, such as Qlik and Tableau that have been at the forefront of data analytics and visualizations since the 1990s and 2000s have gained a lot of competitors in rummaging through business data.
Microsoft released Power BI in 2015 and it is a serious challenger. Similarly to its competitors, its pricing model also caters towards hobby data enthusiasts. If the finished projects are shared with the whole world, you can get away with using the free version of the application.
Create a map visualization in record time
Enho demonstrates how she utilized open data from the HRI-service in her favorite visualization that displays City of Vantaa’s current job openings. The City of Vantaa has built an open REST API, which provides real-time data on current job openings at the city.
Enho writes the API’s www-request, and the Power BI Desktop -application screen displays a list of included records. “I’ll import all records into the application. The format of the data is ideal, one job opening per row”, praises Heidi Enho.
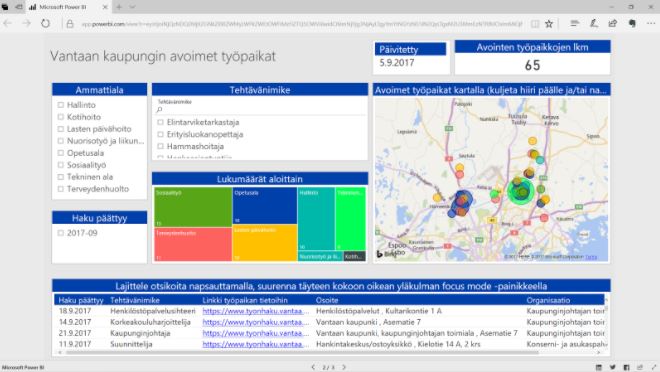
Before starting the actual visualization part, Enho specifies the locations of the job listings into columns by longitude and latitude. In a matter of minutes, the data fetched from the REST API is visualized on the screen. The job openings are showcased by vocation on the map of Vantaa. “Today, there seem to be 71 jobs on offer”, Enho tells and adds the total number of job openings below the map.
Work became a hobby
Providing training for Microsoft products is Heidi Enho’s full-time job. Previously, Excel training was most popular. “Nowadays, I hold more Power BI courses than Excel courses. Demand is very high.”
Easy to use data analytics tools were the starting block for Enho in her open data hobby. The first analyses were born with Excel. “It was like playing around with data. It was fun to think of different ways to visualize the data. And of course to just learn.”
When the Finnish Transport Safety Agency published Finland’s vehicle database as open data, Enho first checked where in Finland people drive with the same car as Enho; a Fiat 500.
What drives an IT-consultant to rummage through data sources in her free time? Enho reveals that at work one can get fed up with sales and financial reports. “It is fun to discover other data sources”, laughs Heidi Enho. “Also, it is beneficial to know about open data resources so one can tell customers about possible use cases.”
Raw data, thank you
Active data enthusiasts have one important request for data publishers. Most published datasets have been processed too far. Lots of datasets include some sort of variable, for example, years as a separate column. “That is not data, it is a report”.
Here, data cleaning and editing tools come to full use. “Power BI can handle structurally challenging datasets into structured pivot tables.” It is a useful functionality, which automatically records a script of data cleaning. With its help, it is easy to repeat every step, when the dataset is updated.
Most recently, Enho was busy with open data last weekend when she was asked to speak at a company summer party. “It felt like it had rained all summer. I wanted to see if this really was the case.”
Heidi Enho used the open data page of the Finnish Meteorological Institute to find data on the average temperatures and precipitation since 1961.
Heidi Enho’s Vilahdus.fi blog, which displays her completed visualizations reveals that at least in Helsinki it did not rain stupendously. “Data tells more than your gut feeling. In Helsinki in July this year, it only rained 59% of the long-term average. In June, the average was exceeded but the month of May was exceptionally dry, the precipitation level was only 38% from the average.”
Translated by: Kaarlo Uutela
Leave a Reply