Best 3D model in the world improves with age
Helsinki’s 3D city model will receive its 2-year update shortly. The designers of the model hope that the increasingly accurate digital twin of constructed Helsinki can be the basis for all urban planning in the future.
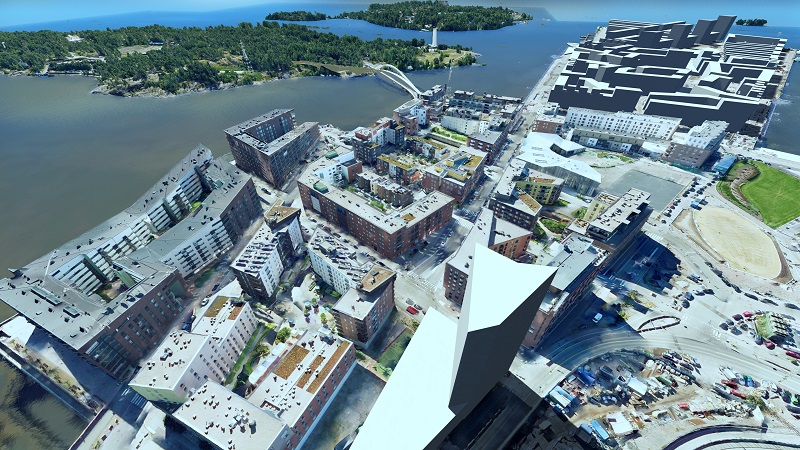
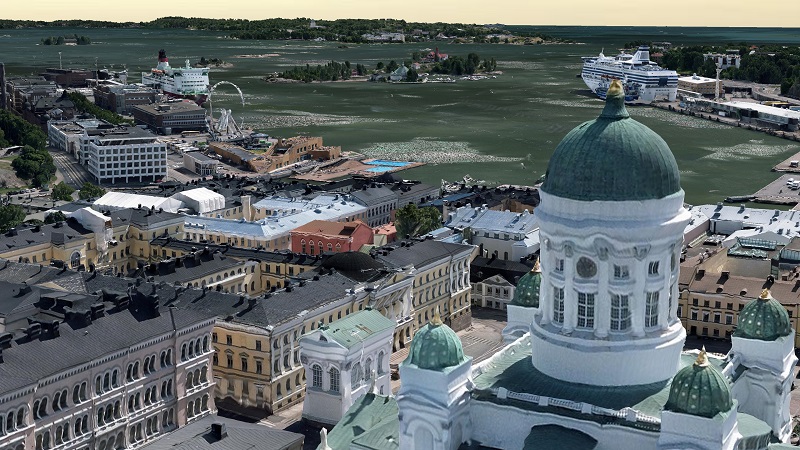
Touted as the world’s finest at the time of their publication, Helsinki’s 3D city models will soon be even finer than before. Before the holidays 2018, a farm of ten computers combined 50,000 aerial photographs shot from an aeroplane during summer 2017 into a photo realistic 3D model that covers entire Helsinki. “We will publish it as open data in the beginning of 2019”, promises Special Planner Enni Airaksinen. At the same time, the Helsinki of 2015 in the current model will be updated to the Helsinki of 2017.

The precision of the city data model, which covers 500 square kilometres and all of the 80,000 buildings of the City, will also be improved considerably. The new laser scanning material which it is based on is increasingly accurate. “The resolution of the current model is 10 cm, while the resolution of the new one is 7,5 cm, which means that the new point cloud has twice the number of points”, says Project Manager Kari Kaisla.
3D city models are not a new invention. The first pieces of 3D Helsinki were presented as early as 1985, but only in this decade they seem to have come to stay. The construction of a model that covers entire Helsinki started four years ago, when Airaksinen’s and Kaisla’s colleague, Project Manager Jarmo Suomisto was able to convince the City leadership of the benefits of the model.
Production automated
Previously, the construction of models was slow manual work with the CAD software, but now the time was right for making the production automatic. The work was also made easier by the open CityGML standard, the first standard presentation method for 3D city information models.
3D Helsinki consists of two separate models. To meet the different visualisation needs, the mesh, or triangular network model, is compiled of 50,000 one hundred megapixel aerial photographs. Using the photorealistic 3D model, it is, for example, possible to sit back and take a “photograph” of any place in Helsinki with a few mouse clicks. The digital view downloaded from the web is open data, which means it can be utilised according to need.
The 3D view of the Helsinki’s CityGML information model includes a vast amount of meta data of the City’s building stock. It is compiled of laser scanning data made at a flying altitude of half a kilometre. The point cloud that has been scanned with a 7,5 centimetre resolution charts the city’s three-dimensional structure. When the data is combined with the city’s map and geographic datasets and the information of the registers, it becomes a dimensionally accurate data model of the city.
The CityGML information model was created with quite minimal human efforts. For example, the different surfaces of the buildings are automatically classified as roofs and walls. Information technology can also determine by itself if the roof of the building is a mansard roof or a traditional saddle roof. In addition to the buildings, Helsinki’s model contains data of surface shapes and water systems.

The most important requisite for creating the models is a high-quality source material. “A point cloud that covers the entire city is needed for the city information model. In 2015 we had for the first time access to laser scanning data of even quality, which covered the entire city”, says Kari Kaisla. “At the same time, we received the first oblique aerial photograph material of entire Helsinki, which can be used for creating a reality mesh model”, tells Enni Airaksinen.
It has been decided that the new models will also be updated. Aerial photo sessions of the city will be undertaken every other year and the material will be used for a new updated mesh model. The city information model of the city’s new building stock is updated almost in real time. “Whenever a new building is filed in the city registers, it is also coming to this city information model”, tells Kari Kaisla. This is not yet an entirely automatic process, as there are no interfaces for moving data from one system to another.
First utilised by urban planners
The first utilisers of 3D Helsinki are the urban planners. Previously, the planners have, for example, been forced to separately model the vicinity of the planning object either with a 3D planning software or by photographing, to be able to present architecture plans to the public. Now the same data can be obtained directly from the 3D city models.
“Previously, we provided the planners with different kinds of files containing basic material. Now we can just give a link to the city model that has been published as open data. From there, the planners can download files of the areas they want, in their preferred formats”, tells IT specialist Hannu Heinonen at the Urban Environment Division. Some planners have already discovered the possibilities of the 3D model, which was introduced two years ago. “Some planning agencies have developed their own tools and platforms, which make use of the 3D Helsinki data”, tells Heinonen.
The direction of urban planning is clear: There is an ongoing transition from 2D planning towards 3D planning. A wish is that Helsinki’s 3D models could in the future be used not only as a basic material for all types of planning, but also for different kinds of analyses. The plans would be made a part of the 3D model and there we would make different kinds of simulations, out which the best plan alternative would then be picked”, envisions Heinonen.
A new type of planning is currently the subject of a pilot study in Kalasatama. Using the city’s 3D model, it is possible to simulate new plans and their effects on, for example, the traffic, city noise or concentrations of fine particles. Enni Airaksinen says that the first thing to be introduced in Kalasatama is a wind simulator, which can be used to study, what kind of wind circumstances there are in the sea shore blocks that are currently being planned. The problems are easy to solve based on the simulations, and the unfeasible solutions do not proceed from the computer screen.

The vision of the creators of the model is that 3D models form the digital footing of the entire city in the future. “We are trying to aim the development in a direction, where, for example, all new construction projects would be presented with a 3D city model”, says Kari Kaisla. This would open the planning of the city for regular city residents as well in an entirely new way.
A wish of the creators of the model is that within a few years, the 3D city model is an always up-to-date digital twin of the physical city – and an essential part of the planning process. “Every time there is a new plan completed, it could be brought to the city model for everyone to see. And when the construction project itself is completed, the model would be updated immediately”, envisions Kaisla.
Utilisation just starting
Thus far, only the surface of 3D models utilisation has been scratched. “When it comes to the utilisation of the models, we are only seeing the beginning of it. This applies to the city’s own organisation, too”, tells Hannu Heinonen. In addition to urban planning, other uses exist in dozens of other areas of city life.
The creators of the model have demoed the uses of the 3D Helsinki model, for example, in Helsinki’s energy and climate atlas that was completed in spring 2018. Enni Airaksinen opens the web service on the screen and starts rummaging through the City’s 80,000 energy certificates and computational energy consumption data. For City-owned residential buildings, it is even possible to view the realised energy consumption figures for 2015 and 2016.
The service is an incredible treasure trove for anyone who is interested in the energy efficiency of construction. A quick glance at the energy consumption data reveals that, for example, the consumption of district heating seems to have dropped drastically when comparing a multi-storey building built in the 1980’s to its recently completed neighbour.
Models such as Helsinki’s city information model have also been constructed in a few cities in Central Europe. Compared to those, the data contents of Helsinki’s models is in a league of its own. A user browsing Helsinki’s information model can by clicking any building in the city see, for example, the year of completion, number of storeys, height and street address. According to Airaksinen, the Germans are jealous of Helsinki’s complete register data. “We get a lot of feedback from Germany. They present this Helsinki model around the world”, laughs Enni Airaksinen.
Potential for solar and geothermal heat figured out
The Energy and Climate Atlas has its own view for the production potential of solar energy. The redder a surface is, the more solar radiation it gets. The reddest glow is on the flats of ridge roof turned towards south. When you click on any of the roof or wall surfaces on the 80,000 buildings in Helsinki, it opens a calculation of the annual solar radiation on the surface in question. The flat roof of my own house seems to get 400,000 kWh of solar radiation per year. If even a tenth of that could be transformed into energy, it would cover a significant part of the real estate electricity consumption.
“The calculation is based on NASA’s data covering 22 years of realised solar radiation amounts. When we add the growing stock to the city information model, we will make the analysis again”, promises Airaksinen. This way, the updated model is an increasingly important tool to those planning a solar electricity investment. The next version of the Energy and Climate Atlas will also include a calculator for the geothermal heat potential of buildings.
From the world’s best to even better
The development team has been even busier since Helsinki’s 3D city models were published in December 2016. In Kalasatama, which was chosen as the test area, there have been experiments such as using light drones instead of airplanes for obtaining model data. “In the summer, we tried both laser scanning and photographing with drones in Kalasatama. We tested, for example, how many flight lines are needed to make a model”, tells Airaksinen.
3D modelling can be made inside, too. Airaksinen presents the results in the 3D model. When you know the right spot, you can push through the wall of the City Hall. The balcony, banquet room and closest rooms of the City Hall have been laser scanned by walking and the 3D interiors made out of them have been added to the 3D model. The model is based on laser scanning data and a few high-resolution photographs”, says Airaksinen.

The City’s data model is also under continuous development. “At first, we test in the Kalasatama area how the bridges, streets and parks with all their associated data can be brought in addition to the buildings from the City’s registers as easily as possible to the 3D model”, says Airaksinen. The quality of the data is improved at the same time. The faults of the City’s 2D register data are revealed, when they are brought to the visual 3D world.
The metropolitan area service map, which includes 20,000 public service points in the Helsinki region is soon three-dimensional as well. “In the future, the service map can be used either in the current 2D view or in 3D Helsinki. Hopefully it will become a good showcase for Helsinki’s 3D models”, wishes Kari Kaisla.
Every time the results of one’s own development work are taken into practical use, the developers are happy. For example, newspaper Helsingin Sanomat’s visualisation of the Pasila high-rise plans, which was made using the Unreal game engine, was elevating. “That was based on the reality mesh model that we published as open data”, tells Kari Kaisla.
Airaksinen was delighted with the new field of Umbra Software, which develops 3D technology for video game developers. They have brought Helsinki’s massive 3D model to their own cloud service, which serves, for example, people who visualise plans. With the Unity game engine and Umbra’s streaming service, the heavy 3D model can be used without lags even on a mobile phone screen.
3D city model creators’ hints to openers of city data
Helsinki’s 3D models
Helsinki uses two new generation 3D city models: a semantic city model and a visually high-level mesh model. Both are open data.
Project Manager Kari Kaisla
- The City’s processes should be developed in such a way that they would, by default, produce open data and also make use of open data in their own operations. The opening of data should not be a separate measure, which follows the actual operations.
- Lean on standards. In this way, for example, the municipalities of the metropolitan area can produce commensurable open data. It serves the utilisers of the materials.
Special Planner Enni Airaksinen
- Opening data makes data reserves familiar to people outside our own organisation. It can help create new co-operations and projects both inside the separate sectors and between sectors. This leads to increased efficiency in the utilisation of the data reserves.
- Opening data expands the potential user base of the data outside the city as well. The private sector is often better equipped than the City when it comes to develop such innovative products and services that can bring benefits to every person who lives or visits the City.
Translation: Henrik Andersson

Leave a Reply