Skip to content
  • FI
  • EN
  • SV
Helsinki • Espoo Site logo Vantaa • Kauniainen
Helsinki • Espoo • Vantaa • Kauniainen
  1. Home
  2. Showcases
  3. Väestötietoruudukon...

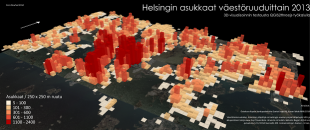
Väestötietoruudukon 3D-visualisointia

Visualizations
  • population
Faris Alsuhail - Published 12.12.2017 - updated 27.6.2022
  1. 2017-12-12-102200.766018vaestoruutupalikatvisualisointipieni-310x130.png

HSY's population grid data as a 3D-visualization using QGIS and it's QGSI2threejs tool. The background orthophotograph is fetched via API from the National Land Survey of Finland's kartat.kapsi.fi service.

The app is no longer available.

Used datasets

  • Population grid of Helsinki metropolitan area

    The population grid contains grid-based data on the population total, age distribution and occupancy rate of the Helsinki metropolitan area. The material covers the years...
    • WFS
    • WMS
    • SHP
    • TAB
    • KML

More from the author

  • HSL:n kaupunkipyörämatkat elokuussa 2019

  • Pysäköinti Kaapeliaukiolla

  • 3D model of Helsinki

  • Vanha Suomenlinna

  • Pysäköintimäärät Helsingissä

Show all from this author

More from the author

  • HSL:n kaupunkipyörämatkat elokuussa 2019

  • Pysäköinti Kaapeliaukiolla

  • 3D model of Helsinki

  • Vanha Suomenlinna

  • Pysäköintimäärät Helsingissä

Show all from this author
  • Data portal arrow_forward
  • Content management arrow_forward
Site logo
Follow us