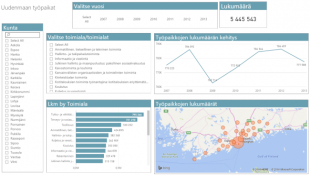
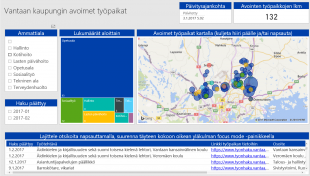
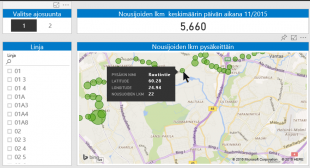
PX-Web-tilastotietokannasta Power BI -raportteja

Heidi Enho - Published 13.12.2017 - updated 15.1.2021
  1. 2017-12-13-124035.390432PX-Web-tilastotietokannastaPowerBI-raportteja-310x175.png

An instruction on how to edit PX-Web data into a visualized report. The data has been downloaded from PX-Web and edited with Power BI Desktop or Excel's Power Query tools. The video shows how to make and publish a simple Power BI visualization report. The Power BI example report has been made with data from the regional statistics API. For the report, the jobs and buildings in the Uusimaa region of Finland have been downloaded. The report has multiple pages, which you can browse to via the bottom tab.

Used datasets

comments powered by Disqus