Interaktiiviset visualisoinnit kaupunkidatalla (Archived)

FloApps Oy - Published 28.11.2017 - updated 27.6.2022

  1. 2017-11-28-090010.582490Interaktiiviset-visualisoinnit-kaupunkidatalla-pieni.png

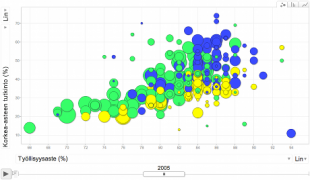
With the visualization, it is possible to examine Helsinki Metropolitan area data on a map with the help of Google Motion chart. The user can choose which areas and phenomenon to examine.

The maintenance of the visualization ended in 2013.

Used datasets

comments powered by Disqus