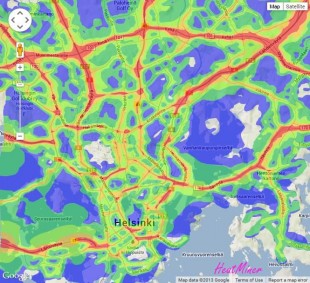
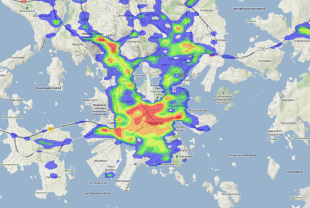
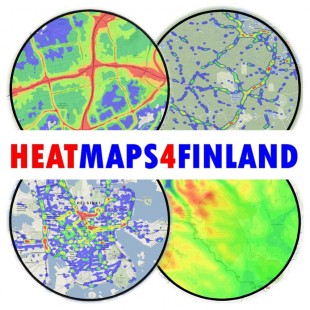
Skip to content
  • FI
  • EN
  • SV
Helsinki • Espoo Site logo Vantaa • Kauniainen
Helsinki • Espoo • Vantaa • Kauniainen
  1. Home
  2. Showcases
  3. Heatmaps4Finland

Heatmaps4Finland

Visualizations
  • traffic
  • traffic accidents
  • noise
Cloud'N'Sci Oy - Published 11.12.2017 - updated 11.12.2017
  1. 2017-12-11-095833.751463Heatmaps4Finland-traffic-accident-heatmap.jpg
  2. 2017-12-11-095833.751783Heatmaps4Finland-traffic-noise-heatmap.jpg
  3. 2017-12-11-095833.752017Heatmaps4Finland-deer-crash-heatmap.jpg

Heatmaps4Finland is a handy web application visualizing Finnish open data as heatmaps on Google Maps. Simply choose one of the available visualization types and pick a location to create a detailed heatmap for the region. If you discover something interesting, share the heatmap with your friends!

Used datasets

  • Traffic noise zones in Helsinki metropolitan area

    The data includes traffic noise zones in the Helsinki metropolitan area (Helsinki, Espoo, Vantaa and Kauniainen). The dataset contains a breakdown of road and rail traffic noise...
    • SHP
  • Traffic Accidents in Helsinki

    The locations, severity levels and types of accidents that have occurred in Helsinki since 2000. The City of Helsinki Urban Environment Division/Traffic and Street Planning...
    • CSV

More from the author

  • Väärin pysäköity!

  • Tieliikenteen melutasot Helsingissä

  • Liikenneonnettomuuksien tiheys lämpökarttana

Show all from this author
Application website arrow_forward Author website arrow_forward

More from the author

  • Väärin pysäköity!

  • Tieliikenteen melutasot Helsingissä

  • Liikenneonnettomuuksien tiheys lämpökarttana

Show all from this author
  • Data portal arrow_forward
  • Content management arrow_forward
Site logo
Follow us