Analysing multi-dimensional data is not easy. Particularly challenging for the ‘data processing system’ of the human brain is numerical data in a table format. When the material is visualised into a graphic presentation, it is easier to form an overall picture of the content.
HRI’s application gallery contains a long list of examples of visualisations making use of open data. Each of these pictures is certainly worth the proverbial ‘thousand words’. The Apps4Finland competition has also rewarded the best data visualisations of the year, ever since its first edition.
Visualisointiblogi
HRI’s visualisation blog is full of good examples of data visualisations as well as visualisation tools and methods.

http://www.hri.fi/fi/category/ajankohtaista/visualisointiblogi/
Hans Rosling
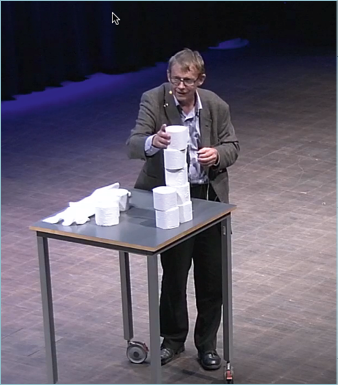
The lecture of Professor Hans Rosling was the most memorable event at the Open Knowledge Festival organised in Helsinki in September 2012. The Swedish data visualisation wizard used toilet rolls to demonstrate why the world’s population is still growing in the next decades although birth rate is slowing down.

Air quality
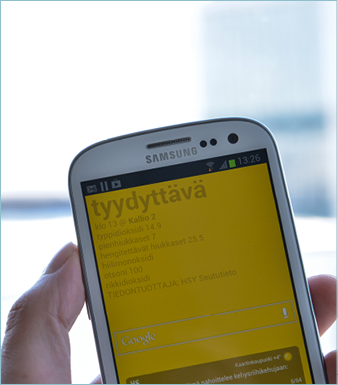
Information technology has opened completely new opportunities to visualisers. The 2012 winner of the Apps4Finland competition in the Visualisation category enables you to see the real-time air quality index as the background colour of your mobile.

Helsingin Code4EU-koodaajat Tuukka Hastrup (vas.) ja Juha Yrjölä päättivät tehdä päivän viikossa toistensa projekteja saman pöydän ääressä. “Kahden ukon tiimi on jo paljon enemmän kuin yhden”, Yrjölä toteaa.

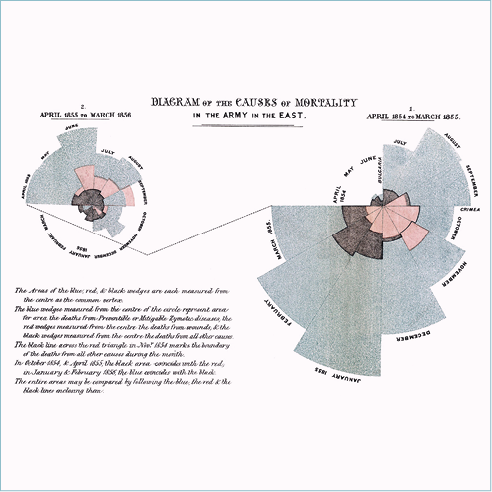
Florence Nightingalen infografiikka vuodelta 1855
Information has been communicated in visual form since the days of cave paintings. A classic example of a good visualisation of numerical data is a diagram designed by Florence Nightingale, the pioneer of modern medical care, demonstrating the deceased troops in the Crimean War in 1855.
The graph underlined the importance of hygiene, and it manages to communicate a shocking observation: the soldiers were seven times more likely to die from diseases that spread in hospitals than from gunshot wounds.
http:// http://en.wikipedia.org/wiki/File:Nightingale-mortality.jpg
Tweet•
The texts of the publication are licensed under the 'HRI-nimeä' attribution. All reuse of the material must be accompanied by the name of the author (Petja Partanen or Terhi Upola) and the publisher (Helsinki Region Infoshare).
Helsinki Region Transport crowdsources public transport navigator
A pioneer of opening public data is experimenting with in-house software development through open source.
Helsinki Region Transport (HRT) is one of the pioneers in opening data in the Helsinki Region. Now HRT has decided to experiment with developing some applications of its own. Application developer Tuukka Hastrup, an expert of the world of open source world, has been hired to help.
As HRT’s partner coder, Tuukka Hastrup’s most important development project is a new kind of navigator programme for users of public transport. The idea is to make the ‘sat nav’ application, which already helps millions of car drivers by giving turn-by-turn guidance, available also to public transport customers.
”The application tells you at which stop you should change buses and whether to head left or right when leaving the stop”, says Hastrup.
The code of the public transport navigator will be published as open source for all to use, and those who make use of the HRT open timetable data are encouraged to join the development project.
”A project like this would include big risks and major financial costs if it was carried out through customary procurement procedures”, says Hastrup.
Hastrup hopes that he can assist his employer also in other IT procurements. When you have the skills to develop programs, you are better equipped to avoid some of the expensive pitfalls.
Code for Europe
The partner programmers of the Code for Europe project develop electronic services for citizens in Helsinki and five other European cities – Amsterdam, Barcelona, Berlin, Manchester and Rome.
http://codeforeurope.net/
